HOT TOPICS LIST
- MACD
- Fibonacci
- RSI
- Gann
- ADXR
- Stochastics
- Volume
- Triangles
- Futures
- Cycles
- Volatility
- ZIGZAG
- MESA
- Retracement
- Aroon
INDICATORS LIST
LIST OF TOPICS
PRINT THIS ARTICLE
by Koos van der Merwe
Analyzing the future is not easy, but technical analysis, especially a combination of Elliott wave theory and Gann analysis, does help.
Position: Sell
Koos van der Merwe
Has been a technical analyst since 1969, and has worked as a futures and options trader with First Financial Futures in Johannesburg, South Africa.
PRINT THIS ARTICLE
GANN ANGLE
Where Now, Dow?
10/02/12 08:29:07 AMby Koos van der Merwe
Analyzing the future is not easy, but technical analysis, especially a combination of Elliott wave theory and Gann analysis, does help.
Position: Sell
| The US Presidential election is one month away. Benjamin Netanyahu of Israel has drawn a red line with regard to the Iran nuclear program. The Mayan calendar is calling for the end of the world on December 21, 2012. What else can go wrong? The bankruptcy of Europe? The resignation of Ben Bernanke, Timothy Geithner, and/or an even greater calamity? Who knows what can trigger a disaster. The world is a very uncertain place at the moment, and Figure 1 is suggesting just that. |

|
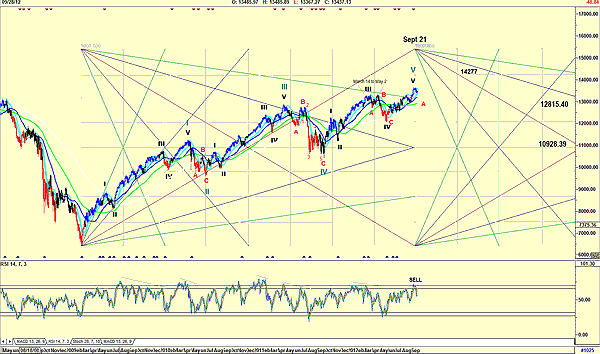
| FIGURE 1: DJIA, DAILY, WITH GANN SQUARE |
| Graphic provided by: AdvancedGET. |
| |
| Figure 1 is a daily chart of the Dow Jones Industrial Average (DJIA) with a Gann square overlaid. The Gann square called for the end of the Elliott wave V on September 21, 2012. With the relative strength index (RSI) showing a sell signal and with the Elliott wave suggesting a wave V of wave V top, this could be very possible, or we could see a sideways move similar to that of wave III of wave V, where it took from March 14 to May 2 for the wave III of wave V to top out in the AB correction. A look at the RSI of previous sells seem to point to a series of divergence sells, where the RSI is falling and the Index is rising, so it is possible that the uncertainty of the Presidential election could delay the expected correction or even lead to the DJIA rising to 14277 for wave V of wave V to top. |

|
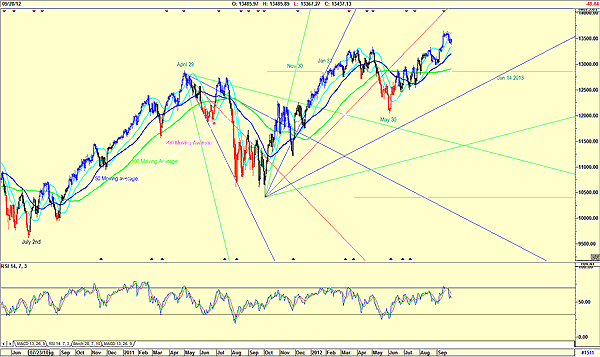
| FIGURE 2: DJIA, DAILY, WITH GANN FANS |
| Graphic provided by: AdvancedGET. |
| |
| Figure 2 is a chart showing the following: a. The 50-period moving average (blue). Still positive b. The 100-period moving average (green). Still positive c. The 200-period moving average (maroon). Positive d. The JM internal band (light blue). The DJIA is testing the lower band but has not given a sell e. Two Gann fans. The best fit according to a move from the low of July 2 to April 29. I am a traditionalist with Gann fans and will only use the squares of 1, 2, 5, 10 and divisions or multiples of those numbers rather than using computer-generated variations. The strategy I am using to time the market is one developed by a friend, Franco du Toit, who was very interested in Gann theory. We draw the Gann fan from a low or a high, adhering to the same square for each fan. Drawing a horizontal line from the previous major high or low gives us an approximate date to expect a turning point. Note how the Gann fan picked up the bottom on November 30, 2011, and the bottom on May 30, 2012. The date of January 31 was nothing. At the moment the fan is calling for a turning point, either a top or bottom on January 14, 2013. |

|
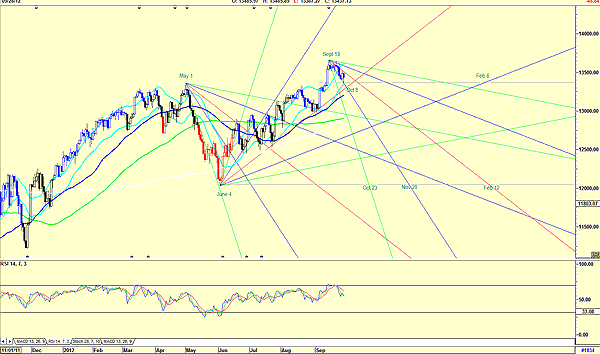
| FIGURE 3: DJIA, DAILY, WITH GANN FANS |
| Graphic provided by: AdvancedGET. |
| |
| Figure 3 is a chart where the Gann fans of Figure 2 are transferred to the latest high and low of May 1 and June 4. The fan of June 4 is suggesting a date of October 8 and February 8, 2013, as turning points. The low of October 8 could be the bottom of the current downtrend if the RSI(14) is correct in its correction. The February 8th date is suggesting either a new high or a new low. By placing the Gann fan on the high of September 13, I am receiving more dates to watch, namely October 23, November 28, and February 12, 2013. The fact that the date of February 12 is close to that of February 8 suggests an important turning point, allowing for a margin of error. There is no doubt in my mind that the DJIA is due for a major correction either now, or after the Presidential election. We could see a low on October 8 with a rise into October 23 and a fall into November 28. That is the assumption I am going to make now, but it can change, depending on the Elliott wave count and the movement of the RSI. |
Has been a technical analyst since 1969, and has worked as a futures and options trader with First Financial Futures in Johannesburg, South Africa.
| Address: | 3256 West 24th Ave |
| Vancouver, BC | |
| Phone # for sales: | 6042634214 |
| E-mail address: | petroosp@gmail.com |
Click here for more information about our publications!
Comments

|

Request Information From Our Sponsors
- VectorVest, Inc.
- Executive Premier Workshop
- One-Day Options Course
- OptionsPro
- Retirement Income Workshop
- Sure-Fire Trading Systems (VectorVest, Inc.)
- Trading as a Business Workshop
- VectorVest 7 EOD
- VectorVest 7 RealTime/IntraDay
- VectorVest AutoTester
- VectorVest Educational Services
- VectorVest OnLine
- VectorVest Options Analyzer
- VectorVest ProGraphics v6.0
- VectorVest ProTrader 7
- VectorVest RealTime Derby Tool
- VectorVest Simulator
- VectorVest Variator
- VectorVest Watchdog
- StockCharts.com, Inc.
- Candle Patterns
- Candlestick Charting Explained
- Intermarket Technical Analysis
- John Murphy on Chart Analysis
- John Murphy's Chart Pattern Recognition
- John Murphy's Market Message
- MurphyExplainsMarketAnalysis-Intermarket Analysis
- MurphyExplainsMarketAnalysis-Visual Analysis
- StockCharts.com
- Technical Analysis of the Financial Markets
- The Visual Investor
