HOT TOPICS LIST
- MACD
- Fibonacci
- RSI
- Gann
- ADXR
- Stochastics
- Volume
- Triangles
- Futures
- Cycles
- Volatility
- ZIGZAG
- MESA
- Retracement
- Aroon
INDICATORS LIST
LIST OF TOPICS
PRINT THIS ARTICLE
by Koos van der Merwe
With the market anticipating the end of the Presidential election, we should start looking for stocks that we would like to own.
Position: Accumulate
Koos van der Merwe
Has been a technical analyst since 1969, and has worked as a futures and options trader with First Financial Futures in Johannesburg, South Africa.
PRINT THIS ARTICLE
ENVELOPES
Edwards Lifesciences
10/01/12 08:57:55 AMby Koos van der Merwe
With the market anticipating the end of the Presidential election, we should start looking for stocks that we would like to own.
Position: Accumulate
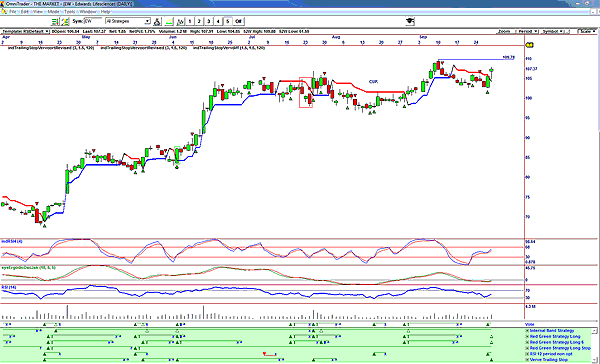
| Edwards Lifesciences (EW) is a worldwide leader in the science of heart valves and hemodynamic monitoring. With changes occurring in the American medical structure, where complicated and expensive medical procedures will gradually become more affordable to the underprivileged, a company in the health sphere becomes a more attractive investment. This share came to my attention when it gave me a buy signal as shown in Figure 1. |

|
| FIGURE 1: EW, DAILY. Daily chart showing buy signal given on the vote line. |
| Graphic provided by: OmniTrader. |
| |
| Figure 1 is a chart of a program I use to identify a share I could consider buying. The vote line on the chart is a summation of the various strategies shown in green. It has given me a buy signal on its recent rise to $107.37. The candlestick formation shown does suggest a hangman used to signal a top in the price rise, but the fact that there is a slight upper shadow above the main body does suggest that this could be a false signal. The three indicators shown, the relative strength index (RSI) 4, the RSI 14, and the ergodic oscillator are all suggesting a buy signal, confirming the signal given by the vote. Note too the cup formation that appears to have formed, suggesting that should the price break above the 109.78 level, an even stronger buy signal will be confirmed. |

|
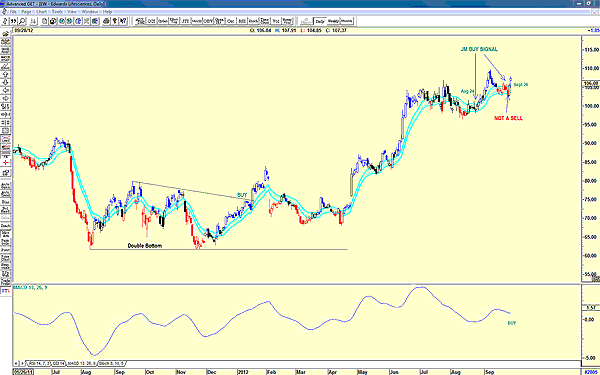
| FIGURE 2: EW, DAILY. Buy signal given by a break above the JM internal band. |
| Graphic provided by: AdvancedGET. |
| |
| Figure 2 is a chart showing the JM internal band line. Note that the share price gave a JM buy signal on August 24 and again on September 26. The indicator and a moving average convergence/divergence (MACD) is suggesting a new buy signal. I would be a buyer of EW, most probably nibbling at the price on any and every correction for a long-term hold. |
Has been a technical analyst since 1969, and has worked as a futures and options trader with First Financial Futures in Johannesburg, South Africa.
| Address: | 3256 West 24th Ave |
| Vancouver, BC | |
| Phone # for sales: | 6042634214 |
| E-mail address: | petroosp@gmail.com |
Click here for more information about our publications!
PRINT THIS ARTICLE

Request Information From Our Sponsors
- StockCharts.com, Inc.
- Candle Patterns
- Candlestick Charting Explained
- Intermarket Technical Analysis
- John Murphy on Chart Analysis
- John Murphy's Chart Pattern Recognition
- John Murphy's Market Message
- MurphyExplainsMarketAnalysis-Intermarket Analysis
- MurphyExplainsMarketAnalysis-Visual Analysis
- StockCharts.com
- Technical Analysis of the Financial Markets
- The Visual Investor
- VectorVest, Inc.
- Executive Premier Workshop
- One-Day Options Course
- OptionsPro
- Retirement Income Workshop
- Sure-Fire Trading Systems (VectorVest, Inc.)
- Trading as a Business Workshop
- VectorVest 7 EOD
- VectorVest 7 RealTime/IntraDay
- VectorVest AutoTester
- VectorVest Educational Services
- VectorVest OnLine
- VectorVest Options Analyzer
- VectorVest ProGraphics v6.0
- VectorVest ProTrader 7
- VectorVest RealTime Derby Tool
- VectorVest Simulator
- VectorVest Variator
- VectorVest Watchdog
