HOT TOPICS LIST
- MACD
- Fibonacci
- RSI
- Gann
- ADXR
- Stochastics
- Volume
- Triangles
- Futures
- Cycles
- Volatility
- ZIGZAG
- MESA
- Retracement
- Aroon
INDICATORS LIST
LIST OF TOPICS
PRINT THIS ARTICLE
by Koos van der Merwe
September is usually the quietest month of the year. Now that it is over, what next?
Position: Sell
Koos van der Merwe
Has been a technical analyst since 1969, and has worked as a futures and options trader with First Financial Futures in Johannesburg, South Africa.
PRINT THIS ARTICLE
RSI
September Segues Into October
09/28/12 08:36:57 AMby Koos van der Merwe
September is usually the quietest month of the year. Now that it is over, what next?
Position: Sell
| History has shown us that September is usually the quietest month of the year -- that after the July-August school holidays, the market examines itself as it moves into October, notorious for its crashes, before deciding to move into the busy months of November to March. With that in mind, what do the charts tell us? |

|
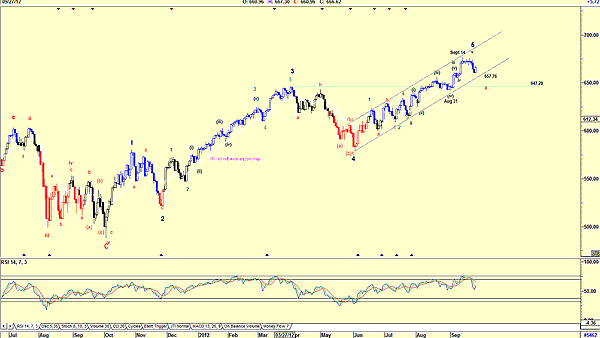
| FIGURE 1: S&P 100, DAILY |
| Graphic provided by: AdvancedGET. |
| |
| Figure 1 is a chart of the Standard & Poor's 100, which shows that the market only started to stall from September 14. The Elliott wave count is suggesting that on that date, the index made a wave 5 top, which means that we can expect an ABC decline into the first weeks of October. The relative strength index (RSI) is confirming this. The index does appear to be testing the 20-period moving average. Should it break through, it will then test the support line in the region of 657.76. However, for the ABC correction to be correct, the index should fall below the 647.28 pivot point, the high of wave 3. |

|
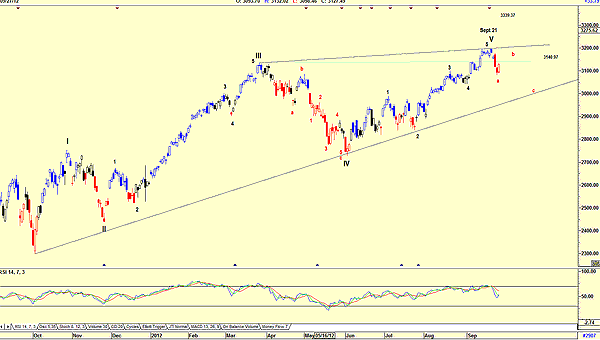
| FIGURE 2: NASDAQ, DAILY |
| Graphic provided by: AdvancedGET. |
| |
| The NASDAQ in Figure 2 is showing a similar wave count, with the difference being that the a-wave down is below the wave 3 level, suggesting that the abc correction could be a mild one. The RSI is also overbought, moving down on a sell signal. I have not included a chart of the DJIA, because the chart is very similar to that of the S&P 100, as is the chart of the S&P 500. All the charts are suggesting a correction into mid-October, probably the result of the Presidential election uncertainty, with a clear direction of the outcome probably occurring mid-October. The Kondratieff wave and Presidential cycle chart published in the June 2012 issue of STOCKS & COMMODITIES is still on track calling for an Obama win, probably a reason why the abc correction will be a mild one. I would not be a buyer of stocks at the moment but would make a list of stocks I would like to own, and buy them around about mid-October on any correction. |
Has been a technical analyst since 1969, and has worked as a futures and options trader with First Financial Futures in Johannesburg, South Africa.
| Address: | 3256 West 24th Ave |
| Vancouver, BC | |
| Phone # for sales: | 6042634214 |
| E-mail address: | petroosp@gmail.com |
Click here for more information about our publications!
Comments

|

Request Information From Our Sponsors
- StockCharts.com, Inc.
- Candle Patterns
- Candlestick Charting Explained
- Intermarket Technical Analysis
- John Murphy on Chart Analysis
- John Murphy's Chart Pattern Recognition
- John Murphy's Market Message
- MurphyExplainsMarketAnalysis-Intermarket Analysis
- MurphyExplainsMarketAnalysis-Visual Analysis
- StockCharts.com
- Technical Analysis of the Financial Markets
- The Visual Investor
- VectorVest, Inc.
- Executive Premier Workshop
- One-Day Options Course
- OptionsPro
- Retirement Income Workshop
- Sure-Fire Trading Systems (VectorVest, Inc.)
- Trading as a Business Workshop
- VectorVest 7 EOD
- VectorVest 7 RealTime/IntraDay
- VectorVest AutoTester
- VectorVest Educational Services
- VectorVest OnLine
- VectorVest Options Analyzer
- VectorVest ProGraphics v6.0
- VectorVest ProTrader 7
- VectorVest RealTime Derby Tool
- VectorVest Simulator
- VectorVest Variator
- VectorVest Watchdog
