HOT TOPICS LIST
- MACD
- Fibonacci
- RSI
- Gann
- ADXR
- Stochastics
- Volume
- Triangles
- Futures
- Cycles
- Volatility
- ZIGZAG
- MESA
- Retracement
- Aroon
INDICATORS LIST
LIST OF TOPICS
PRINT THIS ARTICLE
by Donald W. Pendergast, Jr.
ConocoPhillips stock has risen steadily within the confines of a fixed price channel for more than four months now. Are the shares preparing for another channel support test?
Position: N/A
Donald W. Pendergast, Jr.
Freelance financial markets writer and online publisher of the Trendzetterz.com S&P 500 Weekly Forecast service.
PRINT THIS ARTICLE
CHANNEL LINES
ConocoPhillips Channel Support Test Soon?
10/01/12 11:19:27 AMby Donald W. Pendergast, Jr.
ConocoPhillips stock has risen steadily within the confines of a fixed price channel for more than four months now. Are the shares preparing for another channel support test?
Position: N/A
| Some large-cap stocks tend to trend strongly, perhaps once or twice a year, but most of the time they tend to move in smaller waves that are perfect for swing and intraday traders to play for potential profits. ConocoPhillips (COP) is one of these stocks, and right now, it's offering nimble and savvy short-term traders a low-risk, high-probability shorting opportunity that could trigger a new trade at any moment. Here's a closer look now. |

|
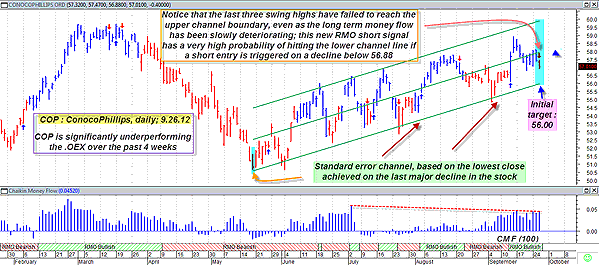
| FIGURE 1: COP, DAILY. With bearishly diverging money flow and slowing upward momentum, shares of ConocoPhillips may again take a trip south to meet its lower channel line. A new short trade entry happens if COP declines below 56.88. |
| Graphic provided by: MetaStock. |
| Graphic provided by: RMO trading system indicators from MetaStock 11. |
| |
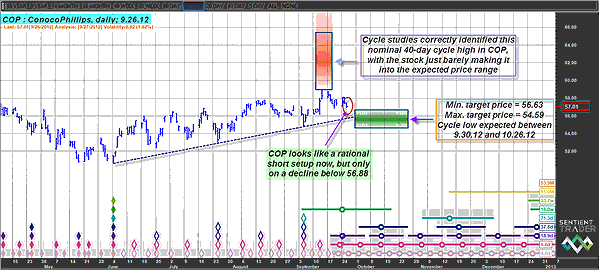
| COP made a major multicycle low on May 18, 2012, finally bottoming out at 50.66 after enduring a nearly 20% decline over the prior 10 weeks. Since then, the stock has traded in a pattern that some swing traders might consider textbook quality, remaining within an uptrending standard error channel (you can plot these in many charting packages, including MetaStock 11) for more than four months. ConocoPhillips has just fired a new RMO (Rahul Mohindar) swing sell signal on its daily chart (Figure 1), one that will trigger a new short entry on a decline below 56.88, and it appears to be a very low-risk trade for three reasons: 1. Long-term money flow (measured with the 100-day Chaikin money flow histogram [CMF][100]) is slowly deteriorating, indicating long-term distribution by the smart money folks. COP also keeps making higher swing highs, but the last three have failed to even reach the upper channel line, confirming a gradual loss of trend momentum. 2. Cycle studies reveal that COP's nominal 40-day cycle (actual length is 37.8 days) is headed lower and is due to bottom out between September 30 and October 26, 2012, within a price range of 54.59 to 56.63. The green time/price (TP) projection box highlights this on the chart; notice how the uptrend line on the cycles chart intersects with the green TP zone, indicating that this could be an area of resistance once COP starts falling again. See Figure 2. 3. The trade offers low-risk and attractive reward characteristics, too. If a short entry is made at 56.87 and an initial stop is placed at 57.48, the nominal risk is $61 for every 100 shares shorted (not including slippage and commissions). The initial profit target is 56.00, allowing for $87 in profit potential (again before slippage and commissions). Therefore, the basic risk/reward ratio for this trade is 87/61 or 1.43 to 1. A two-bar trailing stop (based on the daily highs) should be implemented as soon as possible, but not until such a stop can be placed lower than the initial stop of 57.48. See Figure 3. |

|
| FIGURE 2: COP, DAILY. COP's nominal 40-day price cycle is already falling and is due to bottom in the near future; skilled traders might consider taking half profits near 56.00 (assuming a short is triggered in the first place), letting the balance of the trade run down into the green TP zone. |
| Graphic provided by: Sentient Trader. |
| |
| Skilled traders could even choose to take half profits at 56.00 and then let the rest run, hopefully down into the lower regions of the green TP zone; the two-bar trailing stop of the daily highs should be held until final stopout, regardless. As always, keeping your per-trade risk at a maximum of 1% to 2% will help you to limit losses and preserve trading capital for the balance of your (hopefully) long and satisfying trading career. |

|
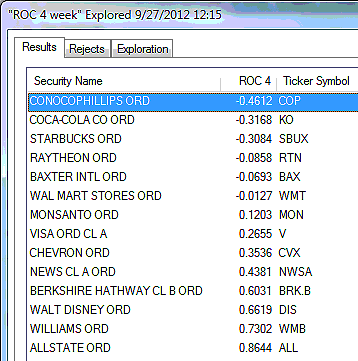
| FIGURE 3: SWING SELL SETUP SIGNALS. The .OEX components that fired RMO swing sell setup signals on Wednesday September 26, 2012. The stocks with the weakest four-week relative strength vs. the .OEX are listed at the top. |
| Graphic provided by: MetaStock. |
| Graphic provided by: MetaStock Explorer. |
| |
Freelance financial markets writer and online publisher of the Trendzetterz.com S&P 500 Weekly Forecast service.
| Title: | Market consultant and writer |
| Company: | Trendzetterz |
| Address: | 81 Hickory Hollow Drive |
| Crossville, TN 38555 | |
| Phone # for sales: | 904-303-4814 |
| Website: | trendzetterz.com |
| E-mail address: | support@trendzetterz.com |
Traders' Resource Links | |
| Trendzetterz has not added any product or service information to TRADERS' RESOURCE. | |
Click here for more information about our publications!
PRINT THIS ARTICLE

Request Information From Our Sponsors
- StockCharts.com, Inc.
- Candle Patterns
- Candlestick Charting Explained
- Intermarket Technical Analysis
- John Murphy on Chart Analysis
- John Murphy's Chart Pattern Recognition
- John Murphy's Market Message
- MurphyExplainsMarketAnalysis-Intermarket Analysis
- MurphyExplainsMarketAnalysis-Visual Analysis
- StockCharts.com
- Technical Analysis of the Financial Markets
- The Visual Investor
- VectorVest, Inc.
- Executive Premier Workshop
- One-Day Options Course
- OptionsPro
- Retirement Income Workshop
- Sure-Fire Trading Systems (VectorVest, Inc.)
- Trading as a Business Workshop
- VectorVest 7 EOD
- VectorVest 7 RealTime/IntraDay
- VectorVest AutoTester
- VectorVest Educational Services
- VectorVest OnLine
- VectorVest Options Analyzer
- VectorVest ProGraphics v6.0
- VectorVest ProTrader 7
- VectorVest RealTime Derby Tool
- VectorVest Simulator
- VectorVest Variator
- VectorVest Watchdog
