HOT TOPICS LIST
- MACD
- Fibonacci
- RSI
- Gann
- ADXR
- Stochastics
- Volume
- Triangles
- Futures
- Cycles
- Volatility
- ZIGZAG
- MESA
- Retracement
- Aroon
INDICATORS LIST
LIST OF TOPICS
PRINT THIS ARTICLE
by Donald W. Pendergast, Jr.
Shares of Agnico-Eagle Mines, Ltd., rose more than 66% between early April and mid-September 2012. Is this party finally over?
Position: N/A
Donald W. Pendergast, Jr.
Freelance financial markets writer and online publisher of the Trendzetterz.com S&P 500 Weekly Forecast service.
PRINT THIS ARTICLE
CYCLES
More Downside For AEM, Then A Rally?
09/28/12 12:53:42 PMby Donald W. Pendergast, Jr.
Shares of Agnico-Eagle Mines, Ltd., rose more than 66% between early April and mid-September 2012. Is this party finally over?
Position: N/A
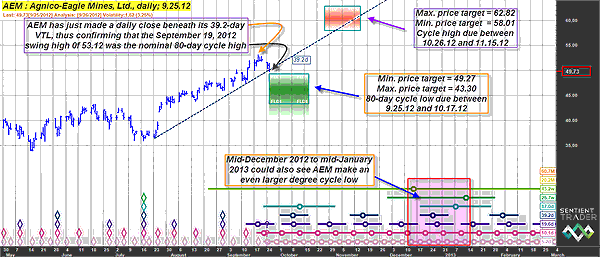
| For experienced market technicians and traders, the recent bearish reversal in precious metals mining stocks comes as little surprise. Many gold/silver mining stocks were under long-term distribution (smart money selling out to latecomers as the latest two-month rally matured) even as their price cycles were indicating that multicycle highs were very likely being made. So, here we are, just a few trading days after the precious metals stock industry group has rolled over after an astounding rally -- what's next? Is a major, bearish trend reversal just beginning, or are we to expect nothing more than a proportional pullback before even higher price levels are attained? For some answers, here's a look at AEM's daily cycles chart, a chart that looks very similar to those of other large-cap PM stocks. See Figure 1. |

|
| FIGURE 1: AEM, DAILY. A decline into the lower portion of the green time/price projection zone will not necessarily violate the overall proportion of the rally that began in April 2012, but only if AEM can make it back up into the red time/price projection zone by late October to mid-November 2012. |
| Graphic provided by: Sentient Trader. |
| |
| The first thing some traders and investors would notice here on AEM's chart is the trendline (also known as a valid trendline, or VTL) that connects the July 23, 2012, low of 36.36 with both the September 12, 2012, low and the recent pullback low of 49.66. AEM has actually closed just a bit below the VTL -- a technical breakdown of that support level -- but what happens next is more important to current AEM longs and prospective shorts. The cycle studies paint a very clear picture of the anticipated 80-day (nominal) cycle lows and highs in this stock, and if this cyclical assessment is reasonably reliable, then it appears that AEM's current slide southward is due to end sometime between September 25 and October 17, 2012, in the price range of 43.30 to 49.27. If AEM hits the lower end of that range, it would qualify as a 62% Fibonacci retracement of the entire run higher from late July 2012 as well as being a 50% pullback of the complete April to September rally, too. What this means is that even a deep pullback into the lower 43.00 area won't necessarily derail the overall long-term uptrend in the stock, one that began nearly six months ago. Long-term money flow is still in positive territory, although there was plenty of evidence of distribution (starting in early August 2012) when measured with shorter term money flow indicators. |

|
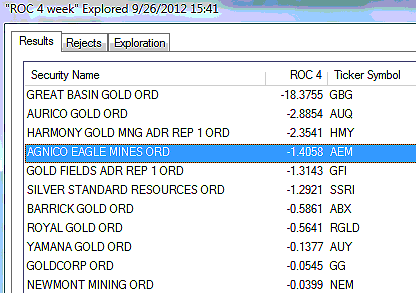
| FIGURE 2: LARGE-CAP MINING. AEM has been significantly underperforming its parent ETF (GDX) over the past four weeks and is one of the weakest among large-cap mining issues. |
| Graphic provided by: MetaStock. |
| Graphic provided by: MetaStock Explorer. |
| |
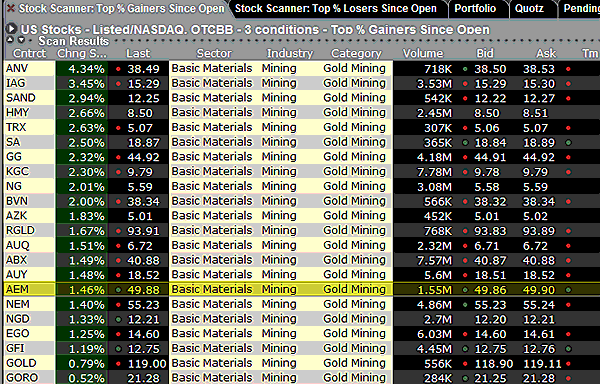
| AEM's nominal 80-day cycle is also expected to pull the stock's price well above where it sits now, possibly as high as 62.82 by November 15, 2012 -- but only after its current correction is over. The red time/price projection box (Figure 2) depicts this nicely. Note how the sense of proportion between the April-July 2012 lows, the projected pullback zone, and subsequent rally zone all combine to produce a sense of harmonious proportion and ratio. If these cycle studies prove accurate, then what we are witnessing now in AEM is a correction (possibly a deep one) rather than a bearish trend reversal. AEM is very weak in terms of four-week relative strength (versus GDX, its parent ETF) (Figure 3) now, and since there is a likelihood of further declines (Wednesday's minor bounce notwithstanding) it may be that AEM is offering a long put setup now, just before another, still-larger decline appears. The December '12 $50.00 AEM puts are selling for about $4.25 and could offer a relatively low-risk way to play a continued move lower in AEM over the next week or two, so check them out for yourself. When trading long calls and puts, it's always a good idea to close out the trade if the option doubles in price (for a 100% gain) or declines by 50% (for a loss) or if your well-thought-out profit target is hit before the option actually doubles in value. That's some of the best option trading advice you'll ever get, by the way, and it really is a great way to manage risk and keep your sanity when entering the decidedly nonlinear world of option trading! |

|
| FIGURE 3: GOLD & SILVER. Gold/silver mining stocks stage a relief rally on Wednesday, September 26, 2012. Price cycles suggest that many of these stocks will make further declines into early October 2012. |
| Graphic provided by: Interactive Brokers TWS Option Trader. |
| |
Freelance financial markets writer and online publisher of the Trendzetterz.com S&P 500 Weekly Forecast service.
| Title: | Market consultant and writer |
| Company: | Trendzetterz |
| Address: | 81 Hickory Hollow Drive |
| Crossville, TN 38555 | |
| Phone # for sales: | 904-303-4814 |
| Website: | trendzetterz.com |
| E-mail address: | support@trendzetterz.com |
Traders' Resource Links | |
| Trendzetterz has not added any product or service information to TRADERS' RESOURCE. | |
Click here for more information about our publications!
PRINT THIS ARTICLE

Request Information From Our Sponsors
- VectorVest, Inc.
- Executive Premier Workshop
- One-Day Options Course
- OptionsPro
- Retirement Income Workshop
- Sure-Fire Trading Systems (VectorVest, Inc.)
- Trading as a Business Workshop
- VectorVest 7 EOD
- VectorVest 7 RealTime/IntraDay
- VectorVest AutoTester
- VectorVest Educational Services
- VectorVest OnLine
- VectorVest Options Analyzer
- VectorVest ProGraphics v6.0
- VectorVest ProTrader 7
- VectorVest RealTime Derby Tool
- VectorVest Simulator
- VectorVest Variator
- VectorVest Watchdog
- StockCharts.com, Inc.
- Candle Patterns
- Candlestick Charting Explained
- Intermarket Technical Analysis
- John Murphy on Chart Analysis
- John Murphy's Chart Pattern Recognition
- John Murphy's Market Message
- MurphyExplainsMarketAnalysis-Intermarket Analysis
- MurphyExplainsMarketAnalysis-Visual Analysis
- StockCharts.com
- Technical Analysis of the Financial Markets
- The Visual Investor
