HOT TOPICS LIST
- MACD
- Fibonacci
- RSI
- Gann
- ADXR
- Stochastics
- Volume
- Triangles
- Futures
- Cycles
- Volatility
- ZIGZAG
- MESA
- Retracement
- Aroon
INDICATORS LIST
LIST OF TOPICS
PRINT THIS ARTICLE
by Donald W. Pendergast, Jr.
Ebay has had a terrific bull run for nearly a full year now; after it completes a further pullback, will it rise yet again?
Position: N/A
Donald W. Pendergast, Jr.
Freelance financial markets writer and online publisher of the Trendzetterz.com S&P 500 Weekly Forecast service.
PRINT THIS ARTICLE
CYCLES
More Pullback Due For eBay?
09/27/12 11:24:02 AMby Donald W. Pendergast, Jr.
Ebay has had a terrific bull run for nearly a full year now; after it completes a further pullback, will it rise yet again?
Position: N/A
| eBay (EBAY) has long been considered a very trendworthy stock, and its recent bullish run certainly confirms that belief. Since October 4, 2011, the stock is up nearly 80%, even including the last few days of bearish price action for the issue. All trends eventually come to an end, but for now, price cycle analysis confirms that while EBAY is still projected to fall lower in the near term before making a meaningful -- and tradable -- cycle low, the same cycles are also anticipating that the stock will also have a final surge higher between late October and early November 2012. Here's a closer look now. |

|
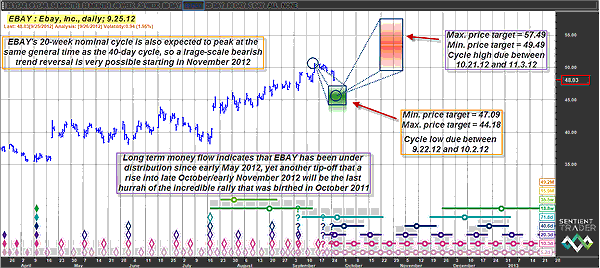
| FIGURE 1: EBAY, DAILY. With EBAY being under long-term distribution since May 2012, any subsequent bounce back up into the red time/price projection zone might just turn out to be the final run higher of the massive rally that launched in October 2011. |
| Graphic provided by: Sentient Trader. |
| |
| Let's face it, an 80% gain in a large-cap, widely followed stock in less than a year is pretty big news, and once the investing public starts getting interested in a big way (usually during the final third of a given move, long after the major opportunity for gain is gone), there is usually room for a bit more gain, which is typically followed by a nasty selloff and one final push higher. On Ebay's daily cycle chart (Figure 1), we see the most recent selloff already under way; the nominal 40-day cycle is still projecting more losses, at least until October 2, 2012. The green time/price projection (TP) box illustrates the anticipated window in which the stock should find support. The price range for the cycle low spans from 44.18 to 47.09. Long-term money flow (not shown) had been deteriorating for more than four months (as the smart money began distributing their shares to the lesser-informed traders and investors) by the time EBAY peaked at 50.65 on September 14, 2012, so this latest downturn isn't surprising at all. |

|
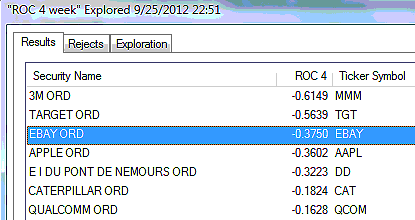
| FIGURE 2: LARGE CAPS. Several large-cap .OEX issues that are underperforming the .NYA (NYSE Composite Index) over the past four weeks. |
| Graphic provided by: MetaStock. |
| Graphic provided by: MetaStock Explorer. |
| |
| Still, the long-term money flow is still well above its zero line, and that's what makes the next cycle study even more valuable, for it's also projecting that EBAY will run higher again (see the red T/P box) after it finds meaningful multicycle support to possibly as high as 57.49 by November 3, 2012. The earliest that a peak may be expected is October 21, 2012, and the minimum price target is 49.48. So if these cycle projections are reasonably accurate (and they do tend to call significant market turns with regularity), then we will have two different trade setups to pursue; the first one is already partially complete, of course, but skilled option traders might want to buy the November '12 $48.00 EBAY puts, but only on an intraday bounce higher to support (near 48.70). The price target for the trade will be the top of the 40-day cycle's green T/P zone near 47.09 and the stop-loss trigger should be set at 49.25, give or take a few pennies. See Figure 2. |
| Concerning the second trade setup (a bounce higher to the red T/P zone), if you see EBAY decline well into the green zone and you get a mechanical buy signal from your favorite trading system close to the end of the time window of the box, consider a long swing trade entry, trailing it with a two-bar stop of the daily lows. Risk no more than 1% to 2% on either of these trades, no matters how bearish/bullish you may be on EBAY right now. |
Freelance financial markets writer and online publisher of the Trendzetterz.com S&P 500 Weekly Forecast service.
| Title: | Market consultant and writer |
| Company: | Trendzetterz |
| Address: | 81 Hickory Hollow Drive |
| Crossville, TN 38555 | |
| Phone # for sales: | 904-303-4814 |
| Website: | trendzetterz.com |
| E-mail address: | support@trendzetterz.com |
Traders' Resource Links | |
| Trendzetterz has not added any product or service information to TRADERS' RESOURCE. | |
Click here for more information about our publications!
Comments

Request Information From Our Sponsors
- StockCharts.com, Inc.
- Candle Patterns
- Candlestick Charting Explained
- Intermarket Technical Analysis
- John Murphy on Chart Analysis
- John Murphy's Chart Pattern Recognition
- John Murphy's Market Message
- MurphyExplainsMarketAnalysis-Intermarket Analysis
- MurphyExplainsMarketAnalysis-Visual Analysis
- StockCharts.com
- Technical Analysis of the Financial Markets
- The Visual Investor
- VectorVest, Inc.
- Executive Premier Workshop
- One-Day Options Course
- OptionsPro
- Retirement Income Workshop
- Sure-Fire Trading Systems (VectorVest, Inc.)
- Trading as a Business Workshop
- VectorVest 7 EOD
- VectorVest 7 RealTime/IntraDay
- VectorVest AutoTester
- VectorVest Educational Services
- VectorVest OnLine
- VectorVest Options Analyzer
- VectorVest ProGraphics v6.0
- VectorVest ProTrader 7
- VectorVest RealTime Derby Tool
- VectorVest Simulator
- VectorVest Variator
- VectorVest Watchdog
