HOT TOPICS LIST
- MACD
- Fibonacci
- RSI
- Gann
- ADXR
- Stochastics
- Volume
- Triangles
- Futures
- Cycles
- Volatility
- ZIGZAG
- MESA
- Retracement
- Aroon
INDICATORS LIST
LIST OF TOPICS
PRINT THIS ARTICLE
by Donald W. Pendergast, Jr.
Shares of Medtronic Inc. are up by more than 21% since early June 2012. Cycle studies indicate a major multicycle high is soon to appear, however.
Position: N/A
Donald W. Pendergast, Jr.
Freelance financial markets writer and online publisher of the Trendzetterz.com S&P 500 Weekly Forecast service.
PRINT THIS ARTICLE
CYCLES
Medtronic Multicycle High Approaches
09/26/12 08:27:02 AMby Donald W. Pendergast, Jr.
Shares of Medtronic Inc. are up by more than 21% since early June 2012. Cycle studies indicate a major multicycle high is soon to appear, however.
Position: N/A
| Many Standard & Poor's 100 (.OEX) component stocks made major multicycle lows on or about June 4, 2012, and Medtronic Inc. (MDT) shares were no exception. The stock is still in rising mode, complete with accelerating uptrend lines and other bullish technicals in place. What could possibly derail this stock now? Some very convincing evidence suggests that MDT may soon make a major high prior to experiencing a trend reversal. |

|
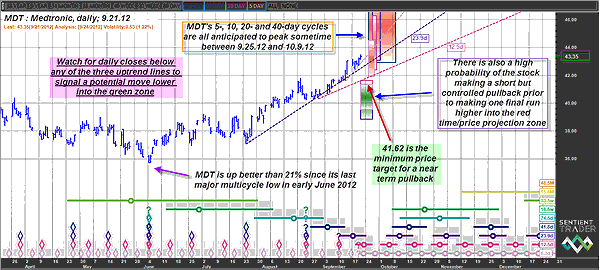
| FIGURE 1: MDT, DAILY. With five different cycles all in agreement that MDT is to soon make a pullback, those with existing longs in this stock may want to make sure they have trailing stops in place. Speculative traders may also want to buy put options once the top trendline is broken on a daily close. |
| Graphic provided by: Sentient Trader. |
| |
| One of the great things about price cycles -- if correctly analyzed and interpreted -- is that they can frequently serve as advance warning signs of upcoming, high-probability cycle highs and lows. This gives existing longs (or shorts) some extra time to adjust, protect, or even liquidate their positions before waiting for the actual market turn or reversal to actually occur. Such is the case here on MDT's daily cycles chart (Figure 1). Five cycles, ranging from 80 days to five days, are all in agreement that MDT is due to make a short-term pullback (green shaded area) sometime between now and September 27, 2012. Now, while this appears to be counterintuitive (particularly for trend-followers) in nature, it's hard to argue with five consecutive cycles that are almost in perfect agreement that a pullback is a high-probability event. The price range for this likely pullback is between 38.81 and 41.62, and for MDT to manage a daily close somewhere in the green box, it needs to break the three uptrend lines depicted. If the move does happen, each break of a line will be confirming the pullback. |

|
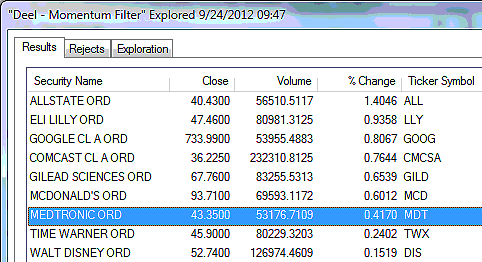
| FIGURE 2: HIGH-MOMENTUM STOCKS. High-momentum .OEX stocks identified by the Deel momentum filter on September 21, 2012. |
| Graphic provided by: MetaStock. |
| Graphic provided by: Deel Momentum Filter from MetaStock 11. |
| |
| There's still some good news for MDT bulls, however. Should the likely pullback be relatively mild, four separate cycles are also in agreement that the stock will try to make another, final push higher (into the red time/price projection zones) sometime between September 25 and October 9, 2012. The maximum price target is 48.19. The red zone, if MDT does make it back up there by early October 2012, is probably going to be the high price zone for the year for the stock, and a substantial trend reversal becomes likely after such a major multicycle high is achieved. See Figure 2. |
| Playing MDT on the short side might look something like this: 1. Wait for the stock to make a daily close below the upper trendline. 2. If the price drop below the low of the previous day, buy a November '12 MDT $44.00 put option(s) at market and set a profit target of 42.00 (just above the lower trendline and green projection box). 3. Manage the trade by watching the price of the put option. If it doubles in price before the price target is hit, close the trade for a profit. If the trade doesn't pan out and the value of your long put declines by half, sell it at a loss and wait for a better trade setup to appear. Risk no more than 1% or 2% on this (or any other) trade and you'll not only have a high-probability trade setup to work with, but also a sane way to keep from letting your emotions or trading biases from putting on positions too large for your account size. |
Freelance financial markets writer and online publisher of the Trendzetterz.com S&P 500 Weekly Forecast service.
| Title: | Market consultant and writer |
| Company: | Trendzetterz |
| Address: | 81 Hickory Hollow Drive |
| Crossville, TN 38555 | |
| Phone # for sales: | 904-303-4814 |
| Website: | trendzetterz.com |
| E-mail address: | support@trendzetterz.com |
Traders' Resource Links | |
| Trendzetterz has not added any product or service information to TRADERS' RESOURCE. | |
Click here for more information about our publications!
PRINT THIS ARTICLE

Request Information From Our Sponsors
- StockCharts.com, Inc.
- Candle Patterns
- Candlestick Charting Explained
- Intermarket Technical Analysis
- John Murphy on Chart Analysis
- John Murphy's Chart Pattern Recognition
- John Murphy's Market Message
- MurphyExplainsMarketAnalysis-Intermarket Analysis
- MurphyExplainsMarketAnalysis-Visual Analysis
- StockCharts.com
- Technical Analysis of the Financial Markets
- The Visual Investor
- VectorVest, Inc.
- Executive Premier Workshop
- One-Day Options Course
- OptionsPro
- Retirement Income Workshop
- Sure-Fire Trading Systems (VectorVest, Inc.)
- Trading as a Business Workshop
- VectorVest 7 EOD
- VectorVest 7 RealTime/IntraDay
- VectorVest AutoTester
- VectorVest Educational Services
- VectorVest OnLine
- VectorVest Options Analyzer
- VectorVest ProGraphics v6.0
- VectorVest ProTrader 7
- VectorVest RealTime Derby Tool
- VectorVest Simulator
- VectorVest Variator
- VectorVest Watchdog
