HOT TOPICS LIST
- MACD
- Fibonacci
- RSI
- Gann
- ADXR
- Stochastics
- Volume
- Triangles
- Futures
- Cycles
- Volatility
- ZIGZAG
- MESA
- Retracement
- Aroon
INDICATORS LIST
LIST OF TOPICS
PRINT THIS ARTICLE
by Donald W. Pendergast, Jr.
Shares of Time Warner have enjoyed a steady rally since early June 2012. Is this bull run nearly over?
Position: N/A
Donald W. Pendergast, Jr.
Freelance financial markets writer and online publisher of the Trendzetterz.com S&P 500 Weekly Forecast service.
PRINT THIS ARTICLE
CYCLES
Time Warner Peaking Before Pullback?
09/25/12 08:21:03 AMby Donald W. Pendergast, Jr.
Shares of Time Warner have enjoyed a steady rally since early June 2012. Is this bull run nearly over?
Position: N/A
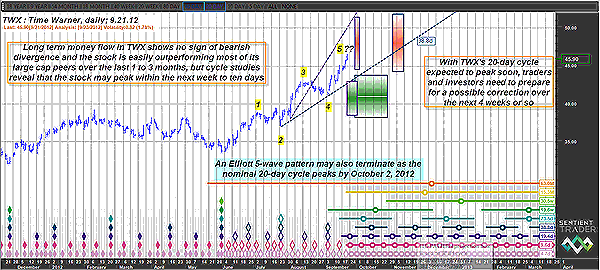
| Since making a major multicycle low on June 4, 2012, Time Warner (TWX) shares have risen by more than 26% and are still outperforming the .OEX (Standard & Poor's 100) over the most recent four-week period. For that matter, TWX is also performing far better than the .OEX and .SPX over the past 13 weeks (one calendar quarter), too. But is this bullishness soon due to fade in the stock, despite the fact that several of its key technicals are still very positive? Here's a closer look at TWX's daily cycles chart now (Figure 1). |

|
| FIGURE 1: TWX, DAILY. With a nicely formed five-wave Elliott pattern on the move toward the nominal 20-day cycle high zone in TWX, savvy traders will begin preparing for the possibility of a trend reversal soon. |
| Graphic provided by: Sentient Trader. |
| |
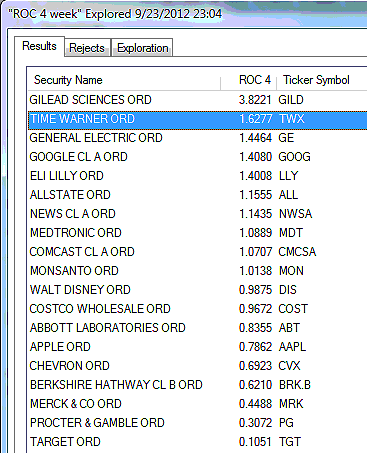
| While it sometimes appears to be at odds with sound logic to start anticipating a possible correction and/or trend reversal in a stock that has been in a multimonth uptrend, in reality, if you are relying on leading technical indicators and tools to do the heavy lifting of forecasting, you can end up with some very good and highly useful time/price projections that can help you as a discretionary or even as a mechanical system trader. And just what is a leading indicator anyway? Fibonacci retracement/expansion levels are one example, as are price/momentum and price/money flow divergences. Trendlines and support resistance lines can also act as leading indicators if plotted and interpreted properly; what all of these indicators and tools have in common is that they can sometimes provide advance warning of logical time/price interaction zones from which reversals can frequently materialize. But an even better leading indicator, at least for some traders, happens to involve the use of price cycle analysis. When identified and interpreted correctly, cycle analysis can be a potent tool to preidentify areas of high-probability reversals and continuation moves. When used with money flow and Fibonacci retracement analysis, the use of cycles can become even more powerful. See Figure 2. |

|
| FIGURE 2: LARGE CAPS. Here are the large-cap stocks that are outperforming the .OEX over the past four weeks. |
| Graphic provided by: MetaStock. |
| Graphic provided by: MetaStock Explorer. |
| |
| Currently, four separate price cycles in TWX are strongly suggesting that the stock is due to make a significant correction -- most likely between now and October 27, 2012, within the price range of 37.04 and 43.76. TWX is also very close to making a new five-day cycle high (if it hasn't made it already) and should experience at least a couple more days of weakness before rebounding slightly in one final thrust higher. The 20-day cycle is expected to peak between September 28 and October 2, 2012, after which it is very possible that TWX will finally reverse course, declining steadily into mid- to late October 2012. As you look at the chart, notice that TWX is in the fifth wave of a well-defined Elliott wave sequence and that the latest wave is getting very close to the nominal 20-day cycle's time/price projection (TP) zone (leftmost vertical red box). The way this chart is shaping up, it appears that TWX bulls will attempt one final push higher into early October 2012, after which the odds of a sharp correction of this nearly four-month-old bull run will increase exponentially, possibly even pulling prices of TWX down below the 40.00 level. |
| One way to consider playing TWX on the short side is to wait until the stock reaches the red TP zone (but no one knows if the rally will actually carry that far) and then monitor for daily bar mechanical sell signals from your trading system of choice. Once you get a confirmed sell signal, simply buy slightly in-the-money put options with two to three months of remaining time value, attempting to hold them for a trip south down toward the upper boundary of the twin green TP zones depicted on the chart -- to about the 44.00 area. Trade management is fairly simple. If 44.00 is reached, sell the puts and walk away happy. And if the option withers to half of what you paid for it or doubles in price, do the exact same thing and close the trade out, making sure that you haven't risked more than 1% to 2% of your account's value before you put the trade on in the first place. |
Freelance financial markets writer and online publisher of the Trendzetterz.com S&P 500 Weekly Forecast service.
| Title: | Market consultant and writer |
| Company: | Trendzetterz |
| Address: | 81 Hickory Hollow Drive |
| Crossville, TN 38555 | |
| Phone # for sales: | 904-303-4814 |
| Website: | trendzetterz.com |
| E-mail address: | support@trendzetterz.com |
Traders' Resource Links | |
| Trendzetterz has not added any product or service information to TRADERS' RESOURCE. | |
Click here for more information about our publications!
PRINT THIS ARTICLE

Request Information From Our Sponsors
- StockCharts.com, Inc.
- Candle Patterns
- Candlestick Charting Explained
- Intermarket Technical Analysis
- John Murphy on Chart Analysis
- John Murphy's Chart Pattern Recognition
- John Murphy's Market Message
- MurphyExplainsMarketAnalysis-Intermarket Analysis
- MurphyExplainsMarketAnalysis-Visual Analysis
- StockCharts.com
- Technical Analysis of the Financial Markets
- The Visual Investor
- VectorVest, Inc.
- Executive Premier Workshop
- One-Day Options Course
- OptionsPro
- Retirement Income Workshop
- Sure-Fire Trading Systems (VectorVest, Inc.)
- Trading as a Business Workshop
- VectorVest 7 EOD
- VectorVest 7 RealTime/IntraDay
- VectorVest AutoTester
- VectorVest Educational Services
- VectorVest OnLine
- VectorVest Options Analyzer
- VectorVest ProGraphics v6.0
- VectorVest ProTrader 7
- VectorVest RealTime Derby Tool
- VectorVest Simulator
- VectorVest Variator
- VectorVest Watchdog
