HOT TOPICS LIST
- MACD
- Fibonacci
- RSI
- Gann
- ADXR
- Stochastics
- Volume
- Triangles
- Futures
- Cycles
- Volatility
- ZIGZAG
- MESA
- Retracement
- Aroon
INDICATORS LIST
LIST OF TOPICS
PRINT THIS ARTICLE
by Donald W. Pendergast, Jr.
Precious metals stocks have been on a rampage for two months now. Is the rally due for a rest soon?
Position: N/A
Donald W. Pendergast, Jr.
Freelance financial markets writer and online publisher of the Trendzetterz.com S&P 500 Weekly Forecast service.
PRINT THIS ARTICLE
ACCUM./DIST. CHAIKIN
CDE Cycle High Due?
09/25/12 12:56:09 PMby Donald W. Pendergast, Jr.
Precious metals stocks have been on a rampage for two months now. Is the rally due for a rest soon?
Position: N/A
| The Amex Gold Bugs Index (.HUI) has been in a steady, very powerful uptrend since July 24, 2012, and is up by more than 35% since then. The mania aspect of this rally appears to be the driving force now, at least in the near term, with a sharp but short-lived pullback due -- probably sooner than later. Here's a closer look at one of the precious metals mining stocks that is looking especially vulnerable to a pullback in the next week or so. |

|
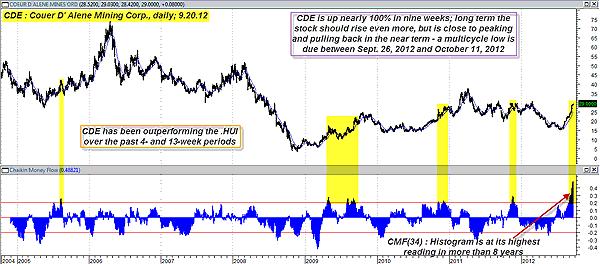
| FIGURE 1: CDE, DAILY. Analysis of CDE's medium-term money flow histogram and its nominal 40-day price cycle suggests that the stock is going to correct in the very near future. The stock's 21-day EMA near 25.17 should offer some support on its initial leg down. |
| Graphic provided by: MetaStock. |
| |
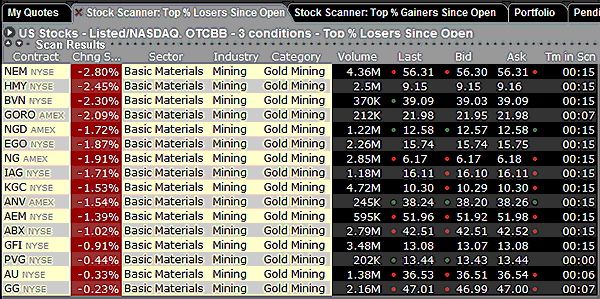
| Coeur D'Alene Mines Corp. (CDE) has also risen sharply since late July 2012 -- up by more than 96% in two months -- far outperforming most of its peers in the .HUI. While that's great news for those who had the foresight to actually buy the stock nine weeks ago, a closer analysis of CDE's money flow situation reveals that the stock is ripe for a near-term pullback before moving on to even higher valuations. If you look at the 34-day Chaikin money flow histograms (CMF), you see that the histogram has reached peaks not previously seen during 2004-12. This strongly suggests that what we are witnessing on CDE's daily chart (Figure 1) is actually a short-term blowoff top in the making, one that could catch a lot of latecomers to this rally off-guard. On the histogram window you see the red overbought/oversold lines. Most of the time, when CDE's money flow histogram crosses above this threshold, a correction in price soon follows; some are large and others are of a minor nature, depending on which combinations of price cycles are driving the stock at a given time. Clearly, CDE's 34-day Chaikin money flow histogram level is at an ultra-extreme level, one that really can't be sustained much longer before some short-term profit-taking ensues. See Figure 2. |

|
| FIGURE 2: PRECIOUS METALS. Precious metals stocks take a beating during the morning trading session on Friday September 21 2012. |
| Graphic provided by: Interactive Brokers TWS Market Scanner. |
| |
| CDE's price cycles are also confirming that the stock is due to make a nominal 40-day cycle low between September 26 and October 11. The minimum price target for low of the pullback is 21.35, which is a nearly $8 per share decline over the next three weeks. At a very minimum, money flow and price cycle analysis are strongly suggesting that existing longs in CDE start aggressively protecting their positions, if not to actually start selling/scaling out altogether. Practically speaking, if Thursday's low of 28.42 is taken out on strong volume, look for CDE to make a quick run south toward its 21-day exponential moving average (EMA), currently near 25.17. The December '12 $29.00 puts are selling for $2.55 and could be a great way to play an upcoming decline in CDE. Using the 21-day EMA as a price target and strict trade management (sell the long put if it doubles in price or declines by 50% after purchase) gives you an objective and sane way to potentially profit on a decline in the stock, without having the same amount of risk as an outright short stock position. Just make sure you limit your risk to 1% to 2% of your account value and don't let your emotions or biases control your trading decisions. |
Freelance financial markets writer and online publisher of the Trendzetterz.com S&P 500 Weekly Forecast service.
| Title: | Market consultant and writer |
| Company: | Trendzetterz |
| Address: | 81 Hickory Hollow Drive |
| Crossville, TN 38555 | |
| Phone # for sales: | 904-303-4814 |
| Website: | trendzetterz.com |
| E-mail address: | support@trendzetterz.com |
Traders' Resource Links | |
| Trendzetterz has not added any product or service information to TRADERS' RESOURCE. | |
Click here for more information about our publications!
PRINT THIS ARTICLE

Request Information From Our Sponsors
- StockCharts.com, Inc.
- Candle Patterns
- Candlestick Charting Explained
- Intermarket Technical Analysis
- John Murphy on Chart Analysis
- John Murphy's Chart Pattern Recognition
- John Murphy's Market Message
- MurphyExplainsMarketAnalysis-Intermarket Analysis
- MurphyExplainsMarketAnalysis-Visual Analysis
- StockCharts.com
- Technical Analysis of the Financial Markets
- The Visual Investor
- VectorVest, Inc.
- Executive Premier Workshop
- One-Day Options Course
- OptionsPro
- Retirement Income Workshop
- Sure-Fire Trading Systems (VectorVest, Inc.)
- Trading as a Business Workshop
- VectorVest 7 EOD
- VectorVest 7 RealTime/IntraDay
- VectorVest AutoTester
- VectorVest Educational Services
- VectorVest OnLine
- VectorVest Options Analyzer
- VectorVest ProGraphics v6.0
- VectorVest ProTrader 7
- VectorVest RealTime Derby Tool
- VectorVest Simulator
- VectorVest Variator
- VectorVest Watchdog
