HOT TOPICS LIST
- MACD
- Fibonacci
- RSI
- Gann
- ADXR
- Stochastics
- Volume
- Triangles
- Futures
- Cycles
- Volatility
- ZIGZAG
- MESA
- Retracement
- Aroon
INDICATORS LIST
LIST OF TOPICS
PRINT THIS ARTICLE
by Donald W. Pendergast, Jr.
Shares of Wal-Mart Stores have enjoyed a sizable rally since late April 2012, and now, cycle studies suggest a pullback is due.
Position: N/A
Donald W. Pendergast, Jr.
Freelance financial markets writer and online publisher of the Trendzetterz.com S&P 500 Weekly Forecast service.
PRINT THIS ARTICLE
CONSOLID FORMATION
WMT Breakdown Looming?
09/24/12 08:48:35 AMby Donald W. Pendergast, Jr.
Shares of Wal-Mart Stores have enjoyed a sizable rally since late April 2012, and now, cycle studies suggest a pullback is due.
Position: N/A
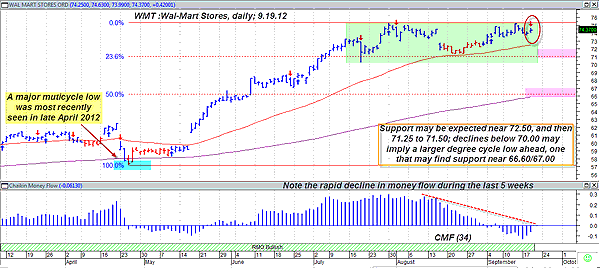
| Some market analysts seem to believe that the economy is slowly recovering from the Great Recession, while others are still focusing on the more troubling -- and persistent -- areas of economic dysfunction that are plaguing the global economy. However, judging from the stellar performance of Wal-Mart Stores (WMT) common stock since April 25, 2012, it would appear that at a very minimum, retail sales were doing okay. After all, the stock rose from 57.18 to 75.25 from then until July 30, 2012, tacking on gains of more than 31% in little more than three months. While this article is not the place to dissect all that's wrong (or even right) with the current economic, political and social issues of our time, at the very least we can make a wise technical evaluation of WMT as we seek to determine if its near-term price direction is up, down, or sideways. Here's a closer look now. |

|
| FIGURE 1: WMT, DAILY. If money flows were still strongly positive, a good case for a bullish continuation move up from the current consolidation could be made; however, that's just not the case, and a modest multicycle low is due within the next couple of weeks in this stock. |
| Graphic provided by: MetaStock. |
| Graphic provided by: RMO trading system indicators from MetaStock 11. |
| |
| It's easy to see that WMT has been in a two-month-long trading range (green shaded area on Figure 1), one that began after the July 30, 2012, high of 75.24 had already been made, and that this long-term consolidation is reasonably proportionate to the large bullish move that preceded it. In a strong bull market, it would be logical to at least allow for the possibility that a bullish continuation move might proceed north out of this pattern, but since the money flows (based on the 34-Chaikin money flow histogram [CMF][34]) are deteriorating so rapidly, perhaps traders and investors should also allow for a near-term pullback, too. Current analysis of WMT's 40-day cycle informs us that the stock is expected to pull back as far as 71.24 between the dates of September 21 and October 4, 2012, so apparently the odds are already stacked in favor of a decline, especially considering WMT's rotten money flow situation. |

|
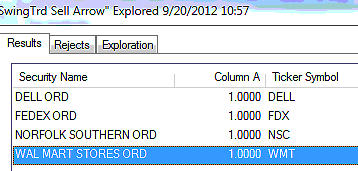
| FIGURE 2: SWING SELL SIGNALS. The .OEX component stocks issuing new RMO swing sell signals as of September 19, 2012. |
| Graphic provided by: MetaStock. |
| Graphic provided by: MetaStock Explorer. |
| |
| WMT has also just fired a new RMO swing sell signal, one that will trigger a new short entry on a decline beneath 73.99; the stock is trading just above its 21-day exponential moving average (EMA) (near 73.70), so if the short trade is filled and then 73.70 is soon afterward taken out, the rundown to the maximum cycle low projection of 71.20 could very well be under way. See Figure 2. WMT's 50-day EMA is near 72.50, which could also allow for some modest resistance. Playing WMT here might best be done with in-the-money put options; the December '12 puts are selling for about $2.36, have a close bid/ask spread, and offer three full months of remaining time value. These puts could be a good choice for traders who are confident of a near-term cycle low in WMT in the next few weeks. Simply buy the put or puts on a decline below 73.99 and then use the 50-day EMA near 72.50 as your initial profit target. As far as risk control goes, one simple strategy is to sell the put as soon as it doubles in price or when it declines in value by half. Long stock options are time- and volatility-sensitive financial instruments. Learning to take reasonable profits and losses is vital if an option trader is to succeed in the long term. |
Freelance financial markets writer and online publisher of the Trendzetterz.com S&P 500 Weekly Forecast service.
| Title: | Market consultant and writer |
| Company: | Trendzetterz |
| Address: | 81 Hickory Hollow Drive |
| Crossville, TN 38555 | |
| Phone # for sales: | 904-303-4814 |
| Website: | trendzetterz.com |
| E-mail address: | support@trendzetterz.com |
Traders' Resource Links | |
| Trendzetterz has not added any product or service information to TRADERS' RESOURCE. | |
Click here for more information about our publications!
PRINT THIS ARTICLE

Request Information From Our Sponsors
- StockCharts.com, Inc.
- Candle Patterns
- Candlestick Charting Explained
- Intermarket Technical Analysis
- John Murphy on Chart Analysis
- John Murphy's Chart Pattern Recognition
- John Murphy's Market Message
- MurphyExplainsMarketAnalysis-Intermarket Analysis
- MurphyExplainsMarketAnalysis-Visual Analysis
- StockCharts.com
- Technical Analysis of the Financial Markets
- The Visual Investor
- VectorVest, Inc.
- Executive Premier Workshop
- One-Day Options Course
- OptionsPro
- Retirement Income Workshop
- Sure-Fire Trading Systems (VectorVest, Inc.)
- Trading as a Business Workshop
- VectorVest 7 EOD
- VectorVest 7 RealTime/IntraDay
- VectorVest AutoTester
- VectorVest Educational Services
- VectorVest OnLine
- VectorVest Options Analyzer
- VectorVest ProGraphics v6.0
- VectorVest ProTrader 7
- VectorVest RealTime Derby Tool
- VectorVest Simulator
- VectorVest Variator
- VectorVest Watchdog
