HOT TOPICS LIST
- MACD
- Fibonacci
- RSI
- Gann
- ADXR
- Stochastics
- Volume
- Triangles
- Futures
- Cycles
- Volatility
- ZIGZAG
- MESA
- Retracement
- Aroon
INDICATORS LIST
LIST OF TOPICS
PRINT THIS ARTICLE
by Matt Blackman
Since the US program of quantitative easing began in earnest in October 2008, stocks and gold are up -- that's no surprise. But how have your stocks performed if we measure them against gold instead of the usual dollar terms?
Position: N/A
Matt Blackman
Matt Blackman is a full-time technical and financial writer and trader. He produces corporate and financial newsletters, and assists clients in getting published in the mainstream media. He is the host of TradeSystemGuru.com. Matt has earned the Chartered Market Technician (CMT) designation. Find out what stocks and futures Matt is watching on Twitter at www.twitter.com/RatioTrade
PRINT THIS ARTICLE
GOLD & METALS
Getting Real On US Stock Market Gains
09/21/12 08:47:03 AMby Matt Blackman
Since the US program of quantitative easing began in earnest in October 2008, stocks and gold are up -- that's no surprise. But how have your stocks performed if we measure them against gold instead of the usual dollar terms?
Position: N/A
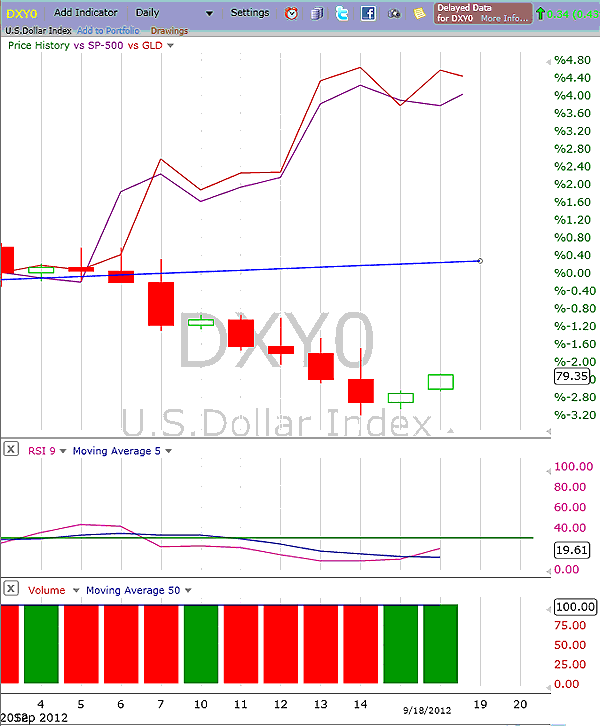
| On September 13, 2012, Federal Reserve chairman Ben Bernanke ended speculation with his announcement that the Fed would begin a third round of quantitative easing (QE3) by spending $40 billion a month of mortgage-backed securities (MBS). But unlike QE1 and QE2, this latest QE program has no expiration date. The move followed on the heels of a similar move by European central bank president Mario Draghi a few days earlier to launch its Outright Monetary Transaction (OMT) program to buy the government bonds of distressed European nations. And while the two programs are patently different in detail, they both have the same broadcasted goal: to boost economic growth and reduce unemployment. Not broadcasted was the timing of the Fed's announcement with the surreptitious goal to provide a short-term lift to November 6. As Figure 1 shows, investors began to bet that QE on both sides of the pond was a forgone conclusion in the first week of September. In the first two weeks of September, the Standard & Poor's 500 gained 4%, GLD was up 4.4%, and the US Dollar Index fell 2.5%. So to gain 400 basis points, it cost the US dollar 250 basis points, leaving the nondollar gain of 150 basis points (1.5%). |

|
| FIGURE 1: DXY, SPX, GLD, DAILY. Here's a daily chart comparing the US Dollar Index (DXY), the S&P 500 in purple, and the SPDRS Gold Trust ETF (GLD) in orange since the beginning of September 2012. |
| Graphic provided by: FreeStockCharts.com. |
| |
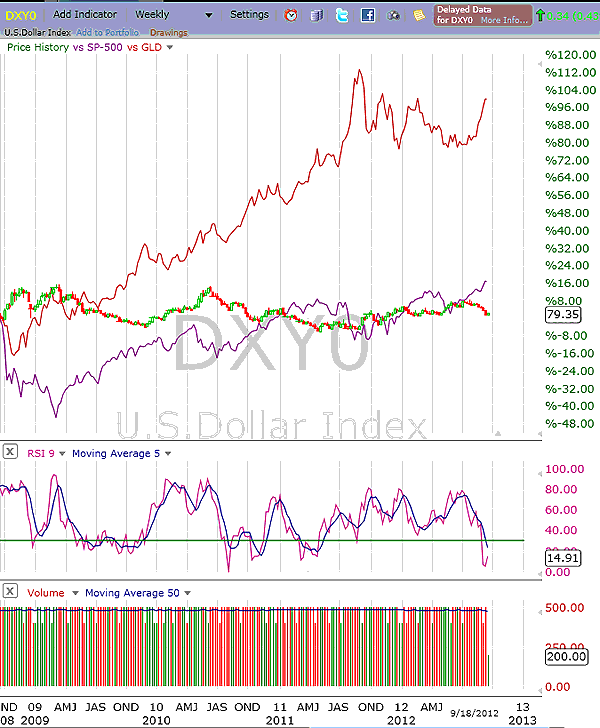
| However, if we look at the same chart since early October 2008 when the first round of quantitative easing began, we get a longer-term view of the effect that QE programs have had in real terms (see Figure 2). Since then, GLD is up 100%, the SPX has gained 16%, and the DXY is basically flat, compared to the basket of other currencies against which it is measured. |

|
| FIGURE 2: DXY, SPX, GLD, WEEKLY. Here's a weekly chart showing the longer-term relationship between the DXY, SPX and GLD. |
| Graphic provided by: FreeStockCharts.com. |
| |
| When measured in gold, the S&P 500 has lost nearly 50% since October 2008. In a September 17, 2012, Bloomberg interview (http://goo.gl/rzhwT ), Frank Holmes of US Global Investors was asked if gold could go to $2,000 per ounce thanks to the latest round of quantitative easing. He gave this target a 12-month window. "Whenever you have negative real interest rates, gold rises," he says. In a healthy economy, interest rates generally run about 2% above the inflation rate, but in today's reality, 5% interest rates would be devastating to the economy, Holmes said. When asked what the "craziest" gold price target he'd heard lately, Holmes replied that if you looked in terms of money supply (M2) growth, gold should be worth $7,000 per ounce. But if the world were to go back to the days of the Bretton Woods agreement pre-August 1971 when gold was convertible into dollars, gold would be worth $40,000 per ounce. Although Holmes doesn't see either of those scenarios happening anytime soon, here is another fact for traders and investors to consider. Since July 1999, when the US stocks peaked in gold terms, the S&P 500 has lost 85% of its value when priced in gold. Given the current penchant for central banks to print their way to prosperity, don't expect this trend to end anytime soon. |
Matt Blackman is a full-time technical and financial writer and trader. He produces corporate and financial newsletters, and assists clients in getting published in the mainstream media. He is the host of TradeSystemGuru.com. Matt has earned the Chartered Market Technician (CMT) designation. Find out what stocks and futures Matt is watching on Twitter at www.twitter.com/RatioTrade
| Company: | TradeSystemGuru.com |
| Address: | Box 2589 |
| Garibaldi Highlands, BC Canada | |
| Phone # for sales: | 604-898-9069 |
| Fax: | 604-898-9069 |
| Website: | www.tradesystemguru.com |
| E-mail address: | indextradermb@gmail.com |
Traders' Resource Links | |
| TradeSystemGuru.com has not added any product or service information to TRADERS' RESOURCE. | |
Click here for more information about our publications!
PRINT THIS ARTICLE

Request Information From Our Sponsors
- StockCharts.com, Inc.
- Candle Patterns
- Candlestick Charting Explained
- Intermarket Technical Analysis
- John Murphy on Chart Analysis
- John Murphy's Chart Pattern Recognition
- John Murphy's Market Message
- MurphyExplainsMarketAnalysis-Intermarket Analysis
- MurphyExplainsMarketAnalysis-Visual Analysis
- StockCharts.com
- Technical Analysis of the Financial Markets
- The Visual Investor
- VectorVest, Inc.
- Executive Premier Workshop
- One-Day Options Course
- OptionsPro
- Retirement Income Workshop
- Sure-Fire Trading Systems (VectorVest, Inc.)
- Trading as a Business Workshop
- VectorVest 7 EOD
- VectorVest 7 RealTime/IntraDay
- VectorVest AutoTester
- VectorVest Educational Services
- VectorVest OnLine
- VectorVest Options Analyzer
- VectorVest ProGraphics v6.0
- VectorVest ProTrader 7
- VectorVest RealTime Derby Tool
- VectorVest Simulator
- VectorVest Variator
- VectorVest Watchdog
