HOT TOPICS LIST
- MACD
- Fibonacci
- RSI
- Gann
- ADXR
- Stochastics
- Volume
- Triangles
- Futures
- Cycles
- Volatility
- ZIGZAG
- MESA
- Retracement
- Aroon
INDICATORS LIST
LIST OF TOPICS
PRINT THIS ARTICLE
by Donald W. Pendergast, Jr.
Tuesday's wild price action in shares of National Oilwell Varco may be an advance warning of an impending change in trend.
Position: N/A
Donald W. Pendergast, Jr.
Freelance financial markets writer and online publisher of the Trendzetterz.com S&P 500 Weekly Forecast service.
PRINT THIS ARTICLE
NEW HIGHS-NEW LOWS
Wide-Range Chaos For NOV?
09/21/12 08:34:42 AMby Donald W. Pendergast, Jr.
Tuesday's wild price action in shares of National Oilwell Varco may be an advance warning of an impending change in trend.
Position: N/A
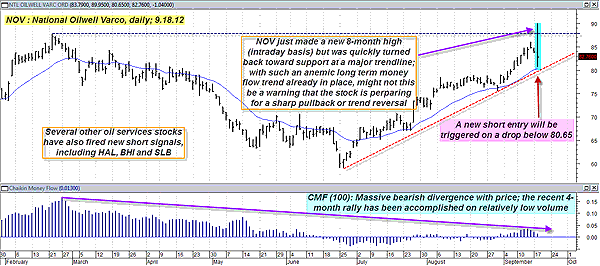
| Imagine, if you will, a large-cap stock that starts the trading session at 83.79, declines steadily throughout the morning and early afternoon to 80.65, and then spikes up to 89.95 in less than two hours -- before plunging again to close out the session at 82.76, only a dollar below where it began the day. Sounds like a rare or even improbable event, doesn't it? Yet that's exactly what happened during Tuesday's trading action in shares of National Oilwell Varco (NOV), a stock that's part of the oil services/oilfield machinery industry group. What's going with this stock anyway? Here's a closer look now. (See Figure 1.) |

|
| FIGURE 1: NOV, DAILY. NOV's wild, wide range price action on Tuesday, September 18, 2012, may be warning traders and investors of an upcoming correction and/or trend reversal in the stock. |
| Graphic provided by: MetaStock. |
| |
| NOV has enjoyed a remarkable rally since making a major multicycle low on June 26, 2012. In less than three months, the stock rocketed from 59.07 all the way to 89.95, a gain of more than 52%. That's a very strong performance for a widely followed large-cap stock, but then again, many energy-related issues can and do embark on strong trend moves several times a year, just as precious metals mining shares do. The long term price cycles in NOV are still quite bullish, but near-term 20-day and 10-day cycles are projecting a further drop in the stock over the next week or so, suggesting that the area near 74.00 to 76.00 could eventually be reached before another run higher can occur. Tuesday's close broke below the 8.9-day valid trendline (VTL), which confirms that the stock has already made its nominal 20-day cycle high. |

|
| FIGURE 2: NOV. National Oilwell Varco trades lower during the morning session on Wednesday, September 19, 2012. |
| Graphic provided by: Interactive Brokers TWS Market Scanner. |
| |
| Analysis of NOV's long-term money flow (based on its 100-day Chaikin money flow [CMF][100] histogram) confirms that the entire rally up from the June 26, 2012, lows has been made on very light volume, creating an incredibly bearish price/money flow divergence pattern. Tuesday's clear repudiation of higher prices in NOV seems to be an advance warning that a huge supply zone of stock exists above 89.95 and that a correction will be needed before NOV can be reasonably expected to make further new highs. A new short-term mechanical short signal for NOV was generated at Tuesday's close as well; a decline below 80.65 will trigger a new short entry. Halliburton (HAL), Baker Hughes (BHI), and Schlumberger (SLB) also fired new short trading signals on Tuesday. With crude oil prices backing off from the psychologically important $100 level, we could see even more erosion in NOV's share price this week and into the end of September 2012. See Figure 2. |
| Playing a short entry in NOV here is very simple. Place a good till canceled (GTC) sell-stop market order to go short on a drop below 80.65 and if filled, immediately place a stop-loss at 82.78. The goal is to hold the short position until NOV hits its major uptrend line (near 79.15) and then run for the hills. This trade is really only for traders who can monitor their positions and charts in real-time and can "read" intraday charts correctly. Put options with two to three months of time value can also be employed in this setup, using the same general stop and target levels. Risk no more than 1% to 2% of your account value here, no matter how bearish you may be on NOV at the moment. |
Freelance financial markets writer and online publisher of the Trendzetterz.com S&P 500 Weekly Forecast service.
| Title: | Market consultant and writer |
| Company: | Trendzetterz |
| Address: | 81 Hickory Hollow Drive |
| Crossville, TN 38555 | |
| Phone # for sales: | 904-303-4814 |
| Website: | trendzetterz.com |
| E-mail address: | support@trendzetterz.com |
Traders' Resource Links | |
| Trendzetterz has not added any product or service information to TRADERS' RESOURCE. | |
Click here for more information about our publications!
PRINT THIS ARTICLE

Request Information From Our Sponsors
- StockCharts.com, Inc.
- Candle Patterns
- Candlestick Charting Explained
- Intermarket Technical Analysis
- John Murphy on Chart Analysis
- John Murphy's Chart Pattern Recognition
- John Murphy's Market Message
- MurphyExplainsMarketAnalysis-Intermarket Analysis
- MurphyExplainsMarketAnalysis-Visual Analysis
- StockCharts.com
- Technical Analysis of the Financial Markets
- The Visual Investor
- VectorVest, Inc.
- Executive Premier Workshop
- One-Day Options Course
- OptionsPro
- Retirement Income Workshop
- Sure-Fire Trading Systems (VectorVest, Inc.)
- Trading as a Business Workshop
- VectorVest 7 EOD
- VectorVest 7 RealTime/IntraDay
- VectorVest AutoTester
- VectorVest Educational Services
- VectorVest OnLine
- VectorVest Options Analyzer
- VectorVest ProGraphics v6.0
- VectorVest ProTrader 7
- VectorVest RealTime Derby Tool
- VectorVest Simulator
- VectorVest Variator
- VectorVest Watchdog
