HOT TOPICS LIST
- MACD
- Fibonacci
- RSI
- Gann
- ADXR
- Stochastics
- Volume
- Triangles
- Futures
- Cycles
- Volatility
- ZIGZAG
- MESA
- Retracement
- Aroon
INDICATORS LIST
LIST OF TOPICS
PRINT THIS ARTICLE
by Matt Blackman
Chart patterns aren't infallible. But when they do fail, what should you do?
Position: Buy
Matt Blackman
Matt Blackman is a full-time technical and financial writer and trader. He produces corporate and financial newsletters, and assists clients in getting published in the mainstream media. He is the host of TradeSystemGuru.com. Matt has earned the Chartered Market Technician (CMT) designation. Find out what stocks and futures Matt is watching on Twitter at www.twitter.com/RatioTrade
PRINT THIS ARTICLE
BULL/BEAR MARKET
Using Pattern Failures To Trade
09/18/12 08:57:47 AMby Matt Blackman
Chart patterns aren't infallible. But when they do fail, what should you do?
Position: Buy
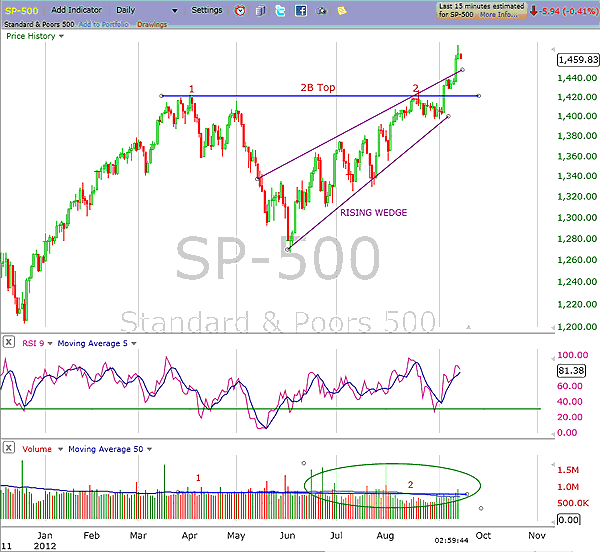
| Back in August, I discussed what looked to be a classic Sperandeo 2B top that was appearing on a number of major indexes and exchange traded funds (ETFs). This bearish pattern unfolded in textbook fashion for about a week or so, but then, based on hope that the Fed (and the European central bank) would intervene and introduce QE3, stocks took off. As we see in the next daily chart of the Standard & Poor's 500 (Figure 1), all of the major requirements for a 2B top failure were met. Volume on the second top was lower and markets had been waffling through the summer doldrums without much in the way of any major news to drive them either way. As the SPX approached overhead resistance at 1420 it briefly pierced resistance, but then, as if prearranged, started falling. |

|
| FIGURE 1: SPX, DAILY. Here's a daily chart of the SPX showing two bearish patterns and how they both failed, thanks to more quantitative easing to bolster the confidence of investors and traders that a rally was at hand. |
| Graphic provided by: FreeStockCharts.com. |
| |
| Continued poor economic data revealed by the European central bank at their meeting on September 6 convinced market players that the chances of more stimulus on both sides of the Atlantic had increased. They bought stocks, in the process pushing the SPX up almost 30 points. The fait accompli came when Fed chair Ben Bernanke delivered his speech a week later, saying that not only was QE3 coming, it would be in place until at least 2015 and possibly longer. Both the 2B top pattern and bearish rising wedge pattern were decisively obliterated. According to stock trader Dan Zanger, pattern failures are often good signals to reverse direction. Those who bought these pattern failures did well indeed. |

|
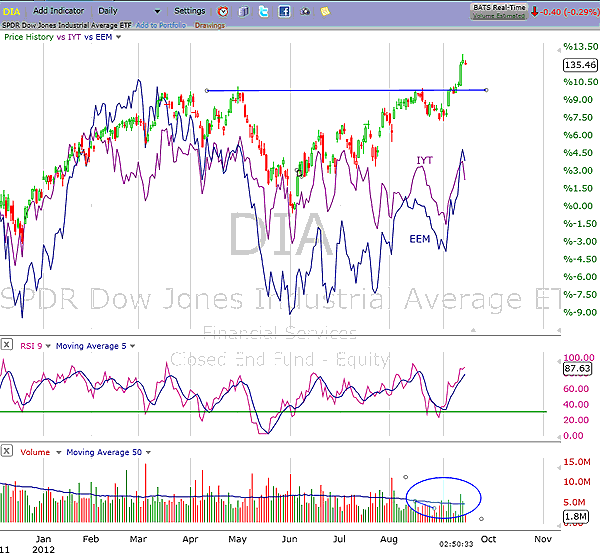
| FIGURE 2: DIA, DAILY. Here's a daily chart of the SPDR Dow Jones Industrial ETF (DIA) with the iShares Dow Jones Transports ETF (IYT) and iShares Emerging Markets ETF (EEM), showing negative divergence of the latter two with the first. |
| Graphic provided by: FreeStockCharts.com. |
| |
| As we see in Figure 2, transports and emerging markets have yet to respond as positively. There are two opposing factors at work, one technical and the second fundamental. Transports and emerging markets often lead industrials lower, but unlimited quantitative easing efforts in both Europe and the US are specifically designed to lift markets heading into Q4. Traders must bet on which factor will be the dominant. There is a well-worn saying in trading circles that tells us never to fight the Fed. Add to the mix that we are also heading into the Presidential election, and history tells us that stocks have no better ally than a President who wants to stay in power come election time. Until there is some technical and fundamental evidence to the contrary, a course of action to join this trade would most likely be wisest. |
Matt Blackman is a full-time technical and financial writer and trader. He produces corporate and financial newsletters, and assists clients in getting published in the mainstream media. He is the host of TradeSystemGuru.com. Matt has earned the Chartered Market Technician (CMT) designation. Find out what stocks and futures Matt is watching on Twitter at www.twitter.com/RatioTrade
| Company: | TradeSystemGuru.com |
| Address: | Box 2589 |
| Garibaldi Highlands, BC Canada | |
| Phone # for sales: | 604-898-9069 |
| Fax: | 604-898-9069 |
| Website: | www.tradesystemguru.com |
| E-mail address: | indextradermb@gmail.com |
Traders' Resource Links | |
| TradeSystemGuru.com has not added any product or service information to TRADERS' RESOURCE. | |
Click here for more information about our publications!
PRINT THIS ARTICLE

Request Information From Our Sponsors
- StockCharts.com, Inc.
- Candle Patterns
- Candlestick Charting Explained
- Intermarket Technical Analysis
- John Murphy on Chart Analysis
- John Murphy's Chart Pattern Recognition
- John Murphy's Market Message
- MurphyExplainsMarketAnalysis-Intermarket Analysis
- MurphyExplainsMarketAnalysis-Visual Analysis
- StockCharts.com
- Technical Analysis of the Financial Markets
- The Visual Investor
- VectorVest, Inc.
- Executive Premier Workshop
- One-Day Options Course
- OptionsPro
- Retirement Income Workshop
- Sure-Fire Trading Systems (VectorVest, Inc.)
- Trading as a Business Workshop
- VectorVest 7 EOD
- VectorVest 7 RealTime/IntraDay
- VectorVest AutoTester
- VectorVest Educational Services
- VectorVest OnLine
- VectorVest Options Analyzer
- VectorVest ProGraphics v6.0
- VectorVest ProTrader 7
- VectorVest RealTime Derby Tool
- VectorVest Simulator
- VectorVest Variator
- VectorVest Watchdog
