HOT TOPICS LIST
- MACD
- Fibonacci
- RSI
- Gann
- ADXR
- Stochastics
- Volume
- Triangles
- Futures
- Cycles
- Volatility
- ZIGZAG
- MESA
- Retracement
- Aroon
INDICATORS LIST
LIST OF TOPICS
PRINT THIS ARTICLE
by Donald W. Pendergast, Jr.
Shares of Walgreen Co. appear to be in the early stages of what could be a significantly bullish continuation move.
Position: N/A
Donald W. Pendergast, Jr.
Freelance financial markets writer and online publisher of the Trendzetterz.com S&P 500 Weekly Forecast service.
PRINT THIS ARTICLE
CONSOLID FORMATION
Walgreen's Preparing For Launch?
09/19/12 08:30:25 AMby Donald W. Pendergast, Jr.
Shares of Walgreen Co. appear to be in the early stages of what could be a significantly bullish continuation move.
Position: N/A
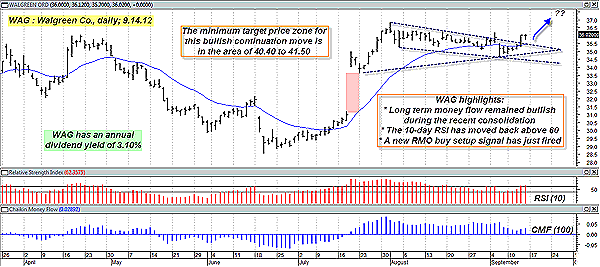
| It's taken a while, but Walgreen's (WAG) share price looks as if it may finally be ready to recover some more of its 2011-12 losses. Between June 20, 2011, and June 19, 2012, the stock dropped by more than 34%, finally finding solid footing as a major multicycle low was made. Since that low was made almost three months ago, the stock is up by 26% and could be setting up for yet another run higher. Here's a closer look now. |

|
| FIGURE 1: WAG, DAILY. With solid money flows and a successful test of support already complete, WAG may be in a prime position to launch into a bullish continuation move soon. |
| Graphic provided by: MetaStock. |
| |
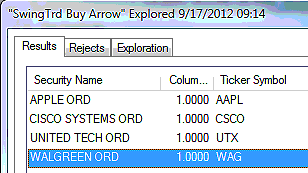
| When you look at the imagery on WAG's daily chart (Figure 1), it's easy to see the bullish implications -- especially if you know what to look for: 1. The massive bullish gap of July 19, 2012, remained unfilled, and in fact, its upper boundary (see pink shaded area) near 34.27 wasn't even touched during the stock's five-week long consolidation/pennant pattern. 2. Long-term money flows (represented by the Chaikin money flow [CMF][100] histogram) remained well above its zero line for the entire period of consolidation. 3. The 10-day relative strength index (RSI) only dipped below 40 on one occasion during the same consolidation. These three technicals are confirming that WAG's recent consolidation is very likely a period of pause in which the stock begins to attract more buying interest prior to another leg higher. The bullish price action in the stock last Thursday and Friday (September 13-14) was strong enough to cause WAG to break above a well-defined down channel and a more loosely formed pennant/triangle formation; Friday's daily price bar also caused an RMO (Rahul Mohindar) swing buy setup signal to fire, and a subsequent rise above 36.12 will trigger a new long entry into WAG. See Figure 2. Another bullish confirmation is the fact that the same 10-day RSI mentioned before has again risen above a value of 60; trend-followers know that a rising RSI (typically at a value above 60 when used with a 10-day or 14-day lookback) is a great trend confirmation tool on virtually any time frame, and that's just what we see at work here on WAG's daily chart. By the way, the minimum price targets for a possible continuation move in WAG are in the range of 40.40 to 41.60. |

|
| FIGURE 2: SWING BUY SETUP SIGNALS. The .OEX component stocks firing RMO swing buy setup signals at the close of trading on Friday, September 14, 2012. |
| Graphic provided by: MetaStock. |
| Graphic provided by: MetaStock Explorer. |
| |
| Playing a potential long entry in WAG on a break above 36.12 is a pretty simple affair. If filled on a buy-stop order, immediately start running a two-bar trailing stop of the daily lows; for example, if filled on Monday, September 17, your initial trailing stop would be based on the previous Thursday's low of 35.28. Try not to risk more than 1% or 2% on this or any other trade, no matter how confident you may be on anybody's evaluation or opinion of WAG's current bullish chart pattern. |
Freelance financial markets writer and online publisher of the Trendzetterz.com S&P 500 Weekly Forecast service.
| Title: | Market consultant and writer |
| Company: | Trendzetterz |
| Address: | 81 Hickory Hollow Drive |
| Crossville, TN 38555 | |
| Phone # for sales: | 904-303-4814 |
| Website: | trendzetterz.com |
| E-mail address: | support@trendzetterz.com |
Traders' Resource Links | |
| Trendzetterz has not added any product or service information to TRADERS' RESOURCE. | |
Click here for more information about our publications!
PRINT THIS ARTICLE

Request Information From Our Sponsors
- StockCharts.com, Inc.
- Candle Patterns
- Candlestick Charting Explained
- Intermarket Technical Analysis
- John Murphy on Chart Analysis
- John Murphy's Chart Pattern Recognition
- John Murphy's Market Message
- MurphyExplainsMarketAnalysis-Intermarket Analysis
- MurphyExplainsMarketAnalysis-Visual Analysis
- StockCharts.com
- Technical Analysis of the Financial Markets
- The Visual Investor
- VectorVest, Inc.
- Executive Premier Workshop
- One-Day Options Course
- OptionsPro
- Retirement Income Workshop
- Sure-Fire Trading Systems (VectorVest, Inc.)
- Trading as a Business Workshop
- VectorVest 7 EOD
- VectorVest 7 RealTime/IntraDay
- VectorVest AutoTester
- VectorVest Educational Services
- VectorVest OnLine
- VectorVest Options Analyzer
- VectorVest ProGraphics v6.0
- VectorVest ProTrader 7
- VectorVest RealTime Derby Tool
- VectorVest Simulator
- VectorVest Variator
- VectorVest Watchdog
