HOT TOPICS LIST
- MACD
- Fibonacci
- RSI
- Gann
- ADXR
- Stochastics
- Volume
- Triangles
- Futures
- Cycles
- Volatility
- ZIGZAG
- MESA
- Retracement
- Aroon
INDICATORS LIST
LIST OF TOPICS
PRINT THIS ARTICLE
by Donald W. Pendergast, Jr.
Shares of United Technology enjoyed a powerful two-day rally in the wake of Thursday's QE3 announcement by the Fed, and a continuation move is likely.
Position: N/A
Donald W. Pendergast, Jr.
Freelance financial markets writer and online publisher of the Trendzetterz.com S&P 500 Weekly Forecast service.
PRINT THIS ARTICLE
BREAKOUTS
UTX To Expect A Continuation Move?
09/18/12 08:24:40 AMby Donald W. Pendergast, Jr.
Shares of United Technology enjoyed a powerful two-day rally in the wake of Thursday's QE3 announcement by the Fed, and a continuation move is likely.
Position: N/A
| When I lived in Connecticut in the 1980s, it always seemed like a rare day when there was no local or national media coverage of at least some aspect of United Technologies (UTX) businesses. After all, their various company divisions made helicopters, elevators, jet engines, air conditioners/HVAC products, electronic security and safety items, and much more. Still based in Hartford, CT, this massive manufacturing/technology conglomerate's overall financial performance is as good an economic bellwether as any when it comes to assessing the state of the US economy. Given its recent stock price performance, it looks like things are going pretty well for UTX; here's a look at the stock's latest powerful breakout now. |

|
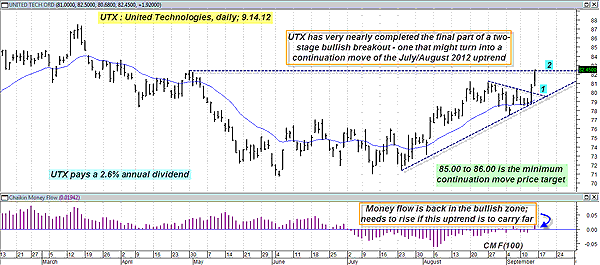
| FIGURE 1: UTX, DAILY. By almost any technical measure, this looks like a very solid, bullish continuation move under way in shares of United Technologies. The stock may make a major multicycle high in the next seven to 10 days. |
| Graphic provided by: MetaStock. |
| |
| United Technologies shares went sideways in a defined trading range for most of June and July 2012 before they began to play catchup and rise along with the rest of the broad markets, starting in early August 2012. The stock made a solid $10 gain (about 14% in two weeks) before making a cycle high and minor pullback. Recent news of another round of quantitative easing (QE3) was more than enough to launch UTX back into bullish orbit, with the stock making solid back-to-back gains on Thursday and Friday (September 13-14). The strong rise from the slightly sloppy triangle pattern (daily chart basis) is now a done deal, with the first stage of the breakout complete (Figure 1). UTX has also managed to rise and close above its April 20, 2012, swing high of 82.46, effectively on the verge of completing a two-stage bullish breakout, one that has all the underpinnings of becoming a continuation of the initial move higher back in August. |

|
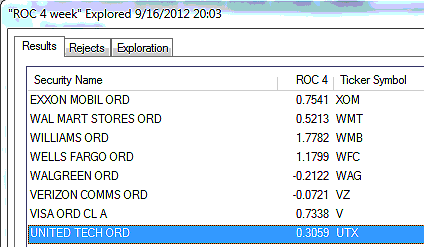
| FIGURE 2: OEX. UTX is easily outperforming the .OEX over the past four weeks. |
| Graphic provided by: MetaStock. |
| Graphic provided by: MetaStock Explorer. |
| |
| In a continuation move, the simplest way to calculate a price target is to measure the length of the initial thrust higher prior to a meaningful consolidation zone. In this case, the initial move up was about $10, so if we add that to the midpoint of the consolidation (about 79.80), we end up with a target of 89.80. It's actually more realistic to take only 50% or 62% of the initial move ($5 or $6.20 in this example of UTX) and then add that to the midpoint of the consolidation instead, as it's highly likely to see garden-variety continuation moves stall out at those levels in the majority of cases. Using more modest targets will help keep a trader more realistic in expectation and more conservative in managing risk; using these figures in UTX means that a realistic target for this continuation move will be in the 85.00-86.00 area. Money flows are now positive, and that also bodes well for the prospect of more gains in the sessions ahead. |
| If you were following my Pendy's Picks articles, then you already know that the .OEX and .SPX is very likely to make a major multicycle high by the end of this month; UTX's newfound strength might also coincide with this anticipated high too, so if you are going to trade UTX from the long side now, it would be wise to run close trailing stops and set realistic profit targets with a high probability of being reached within the next seven to 10 days (Figure 2). Trade wisely until we meet here again. |
Freelance financial markets writer and online publisher of the Trendzetterz.com S&P 500 Weekly Forecast service.
| Title: | Market consultant and writer |
| Company: | Trendzetterz |
| Address: | 81 Hickory Hollow Drive |
| Crossville, TN 38555 | |
| Phone # for sales: | 904-303-4814 |
| Website: | trendzetterz.com |
| E-mail address: | support@trendzetterz.com |
Traders' Resource Links | |
| Trendzetterz has not added any product or service information to TRADERS' RESOURCE. | |
Click here for more information about our publications!
PRINT THIS ARTICLE

Request Information From Our Sponsors
- StockCharts.com, Inc.
- Candle Patterns
- Candlestick Charting Explained
- Intermarket Technical Analysis
- John Murphy on Chart Analysis
- John Murphy's Chart Pattern Recognition
- John Murphy's Market Message
- MurphyExplainsMarketAnalysis-Intermarket Analysis
- MurphyExplainsMarketAnalysis-Visual Analysis
- StockCharts.com
- Technical Analysis of the Financial Markets
- The Visual Investor
- VectorVest, Inc.
- Executive Premier Workshop
- One-Day Options Course
- OptionsPro
- Retirement Income Workshop
- Sure-Fire Trading Systems (VectorVest, Inc.)
- Trading as a Business Workshop
- VectorVest 7 EOD
- VectorVest 7 RealTime/IntraDay
- VectorVest AutoTester
- VectorVest Educational Services
- VectorVest OnLine
- VectorVest Options Analyzer
- VectorVest ProGraphics v6.0
- VectorVest ProTrader 7
- VectorVest RealTime Derby Tool
- VectorVest Simulator
- VectorVest Variator
- VectorVest Watchdog
