HOT TOPICS LIST
- MACD
- Fibonacci
- RSI
- Gann
- ADXR
- Stochastics
- Volume
- Triangles
- Futures
- Cycles
- Volatility
- ZIGZAG
- MESA
- Retracement
- Aroon
INDICATORS LIST
LIST OF TOPICS
PRINT THIS ARTICLE
by Donald W. Pendergast, Jr.
The .OEX rocketed higher on September 13 after the announcement of QE3.
Position: N/A
Donald W. Pendergast, Jr.
Freelance financial markets writer and online publisher of the Trendzetterz.com S&P 500 Weekly Forecast service.
PRINT THIS ARTICLE
TECHNICAL ANALYSIS
PENDY'S PICKS: September 14, 2012
09/14/12 09:53:25 AMby Donald W. Pendergast, Jr.
The .OEX rocketed higher on September 13 after the announcement of QE3.
Position: N/A
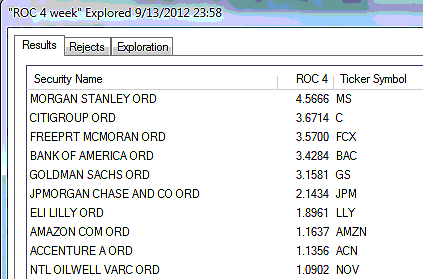
| The .OEX (Standard & Poor's 100) finished Thursday's trading session at 670.93, closing up by 1.76%. Cycle studies in this major large-cap index reveal that little has changed in the way of intermediate- or long-term price targets, despite the apparently bullishness overtaking the broad markets. A large correction is coming soon, and this could be a great opportunity to take some profits and lighten up your portfolio as you wait for the next major multicycle low to reveal itself. Figure 1 shows us the strongest four-week relative strength (RS) performers in the .OEX; five of the top 10 performers (MS, GS, BAC, C, JPM) hail from the financial sector and all had stellar gains on Thursday after money maestro Ben Bernanke unveiled plans for more central bank stimulus operations in the coming months. Amazon (AMZN) continues to outperform, but the smart money appears to be distributing their shares to the less-informed traders and investors in the market. Freeport McMoran (FCX) enjoyed a very strong rally on Thursday, and with money flows still bullish, more gains are possible prior to its upcoming correction. National Oilwell Varco (NOV) is closing in on its February 2012 high of 87.72 but is looking ripe for a near-term pullback; the stock is under distribution and new buying power is fading. |

|
| FIGURE 1: STRONGEST COMPONENTS. The 10 strongest S&P 100 (.OEX) components over the past month, as of Thursday, September 13, 2012. |
| Graphic provided by: MetaStock. |
| Graphic provided by: MetaStock Explorer. |
| |
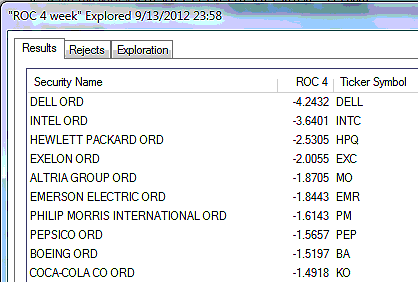
| Figure 2 is a look at the weakest four-week relative strength performers in the .OEX. Dell Computer (DELL) continues to surprise; the stock printed a very bullish reversal bar on Thursday and appears set on recouping at least of few of its recent (and massive) losses. Excelon (EXC) also printed a similarly bullish reversal bar pattern and could be en route to reaching its 21-day exponential moving average (EMA) resistance near 36.40 soon. Hewlett Packard (HPQ) has rallied recently after enduring a deep decline; look for its 50-day EMA (near 18.70) as possible resistance within the next few sessions. Coca Cola (KO) still looks vulnerable to a substantial correction. The stock is under distribution (based on its short- and long-term money flows) and might be ready to start falling again next week. |

|
| FIGURE 2: WEAKEST COMPONENTS. The 10 weakest S&P 100 (.OEX) components over the past month, as of Thursday, September 13, 2012. |
| Graphic provided by: MetaStock. |
| Graphic provided by: MetaStock Explorer. |
| |
| Figure 3 are the S&P 100 components giving overbought and/or exit signals; one stock gave an overbought/exit signal -- Nike (NKE). Depending on how far the recent bullish breakout runs, there could be more overbought/exit signals in the next few sessions, too. |

|
| FIGURE 3: OVERBOUGHT AND/OR EXIT SIGNALS. The S&P 100 (.OEX) components issuing overbought and/or exit signals at the close of trading on Thursday, September 13, 2012; no new buy signals were issued. |
| Graphic provided by: MetaStock. |
| Graphic provided by: MetaStock Explorer. |
| |
| Among the exchange traded funds (ETFs) that Pendy's Picks follows was one overbought/exit signal, in the United States Natural Gas Fund (UNG) ETF (Figure 4). UNG has been slowly rising since late April 2012 after enduring a tortuous multiyear decline and perhaps has turned the corner, finally beginning to escape the clutches of the horrific bear market it had been trapped in. |

|
| FIGURE 4: OVERBOUGHT/EXIT SIGNALS. The exchange traded funds issuing overbought/exit signals on Thursday, September 13, 2012. |
| Graphic provided by: MetaStock. |
| Graphic provided by: MetaStock Explorer. |
| |
| The .OEX vaulted higher yet again on Thursday. Pendy's Picks expects this new rally to be the swan song for not only the June 2012 to September 2012 rally, but perhaps also for the entire bull run higher since March 2009. If you're still long the market, consider booking some gains now and/or moving to cash, as the upcoming correction in the .OEX will likely catch many uninformed traders and investors unawares and in a state of extreme vulnerability. Until we meet again, trade wisely. |
Freelance financial markets writer and online publisher of the Trendzetterz.com S&P 500 Weekly Forecast service.
| Title: | Market consultant and writer |
| Company: | Trendzetterz |
| Address: | 81 Hickory Hollow Drive |
| Crossville, TN 38555 | |
| Phone # for sales: | 904-303-4814 |
| Website: | trendzetterz.com |
| E-mail address: | support@trendzetterz.com |
Traders' Resource Links | |
| Trendzetterz has not added any product or service information to TRADERS' RESOURCE. | |
Click here for more information about our publications!
PRINT THIS ARTICLE

Request Information From Our Sponsors
- StockCharts.com, Inc.
- Candle Patterns
- Candlestick Charting Explained
- Intermarket Technical Analysis
- John Murphy on Chart Analysis
- John Murphy's Chart Pattern Recognition
- John Murphy's Market Message
- MurphyExplainsMarketAnalysis-Intermarket Analysis
- MurphyExplainsMarketAnalysis-Visual Analysis
- StockCharts.com
- Technical Analysis of the Financial Markets
- The Visual Investor
- VectorVest, Inc.
- Executive Premier Workshop
- One-Day Options Course
- OptionsPro
- Retirement Income Workshop
- Sure-Fire Trading Systems (VectorVest, Inc.)
- Trading as a Business Workshop
- VectorVest 7 EOD
- VectorVest 7 RealTime/IntraDay
- VectorVest AutoTester
- VectorVest Educational Services
- VectorVest OnLine
- VectorVest Options Analyzer
- VectorVest ProGraphics v6.0
- VectorVest ProTrader 7
- VectorVest RealTime Derby Tool
- VectorVest Simulator
- VectorVest Variator
- VectorVest Watchdog
