HOT TOPICS LIST
- MACD
- Fibonacci
- RSI
- Gann
- ADXR
- Stochastics
- Volume
- Triangles
- Futures
- Cycles
- Volatility
- ZIGZAG
- MESA
- Retracement
- Aroon
INDICATORS LIST
LIST OF TOPICS
PRINT THIS ARTICLE
by David Penn
A symmetrical triangle heralds the end of a greenback rally against the South African currency.
Position: N/A
David Penn
Technical Writer for Technical Analysis of STOCKS & COMMODITIES magazine, Working-Money.com, and Traders.com Advantage.
PRINT THIS ARTICLE
TRIANGLES
Triangles and the Run of the Rand
07/12/02 08:33:55 AMby David Penn
A symmetrical triangle heralds the end of a greenback rally against the South African currency.
Position: N/A
| Sometimes waiting for a pattern to follow a pattern is waiting too long. Sometimes the breakout from one successful chart formation flows seamlessly into the beginning of a new chart pattern. When this happens, the new chart pattern can serve as a continuation pattern, suggesting further movement in the breakout direction. Other times, however, the new chart pattern ends up confirming the price target of the original chart pattern. |
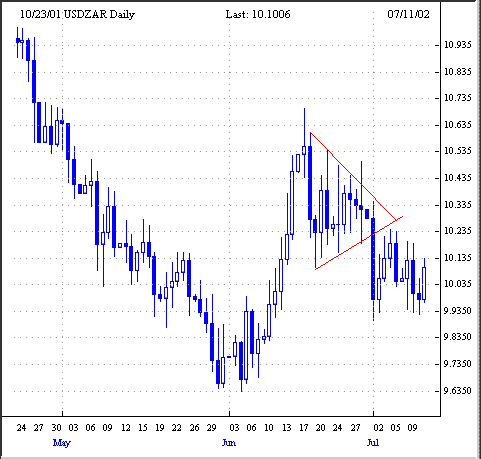
| This appears to be the case in the currency pair USDZAR (U.S. dollar/South African rand). After rising swiftly against the dollar, the rand appeared to top out (bottom out as shown in Figure 1) in June. Strength in the greenback in early June caused the USDZAR pair to rise fairly dramatically before failing just short of the May highs at 106.85. USDZAR has been in a decline since mid-June, a decline characterized in the second half of the month by both higher lows and lower highs. As the first chart shows, a symmetrical triangle soon developed, from which USDZAR broke down at the end of the month. |

|
| Figure 1. The June rally in USDZAR ended with the appearance of this symmetrical triangle top. |
| Graphic provided by: ACTForex Java Charts. |
| |
| The formation size of the June triangle is 0.5. This is derived from the difference between the topmost value in the triangle and the bottommost. From here a price objective can be calculated by subtracting the formation size from the value at the bottom of the triangle, approximately 10.085. This gives a target low of about 9.585, which would represent a new, year-to-date low in the USDZAR. |
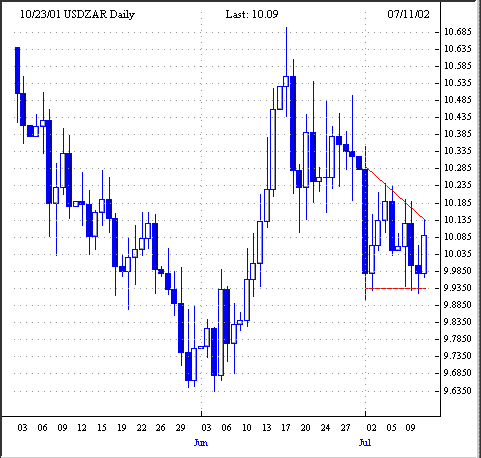
| This triangle, in contrast, is bounded by a horizontal support line that connects the July lows and a downwardly sloping resistance line that connects the July highs. If this pattern of lower highs and steady lows continues, then the likely result is a descending triangle, a bearish chart pattern. |
 Figure 2. A breakdown from this developing descending triangle would also likely take USDZAR to new, year-to-date lows. This descending triangle is perhaps less perfect than the previous, symmetrical version. The extreme highs and lows of the huge down day on July 1 have been disregarded somewhat in order to make the triangle more coherent. Nevertheless, the essentials of the descending triangle -- lower highs and steady lows -- appear to be very much in place, should both the sloping and horizontal trendlines remain effective resistance and support, respectively. Note the likely price target for the descending triangle. The formation size of this triangle is 0.35 measured from the top of the July 1 "real body" to the support area at 9.9350. Formation size subtracted from the value at the support level yields a price objective of 9.5850, identical to the target from the June symmetrical triangle. |
Technical Writer for Technical Analysis of STOCKS & COMMODITIES magazine, Working-Money.com, and Traders.com Advantage.
| Title: | Technical Writer |
| Company: | Technical Analysis, Inc. |
| Address: | 4757 California Avenue SW |
| Seattle, WA 98116 | |
| Phone # for sales: | 206 938 0570 |
| Fax: | 206 938 1307 |
| Website: | www.Traders.com |
| E-mail address: | DPenn@traders.com |
Traders' Resource Links | |
| Charting the Stock Market: The Wyckoff Method -- Books | |
| Working-Money.com -- Online Trading Services | |
| Traders.com Advantage -- Online Trading Services | |
| Technical Analysis of Stocks & Commodities -- Publications and Newsletters | |
| Working Money, at Working-Money.com -- Publications and Newsletters | |
| Traders.com Advantage -- Publications and Newsletters | |
| Professional Traders Starter Kit -- Software | |
Click here for more information about our publications!
Comments

Request Information From Our Sponsors
- StockCharts.com, Inc.
- Candle Patterns
- Candlestick Charting Explained
- Intermarket Technical Analysis
- John Murphy on Chart Analysis
- John Murphy's Chart Pattern Recognition
- John Murphy's Market Message
- MurphyExplainsMarketAnalysis-Intermarket Analysis
- MurphyExplainsMarketAnalysis-Visual Analysis
- StockCharts.com
- Technical Analysis of the Financial Markets
- The Visual Investor
- VectorVest, Inc.
- Executive Premier Workshop
- One-Day Options Course
- OptionsPro
- Retirement Income Workshop
- Sure-Fire Trading Systems (VectorVest, Inc.)
- Trading as a Business Workshop
- VectorVest 7 EOD
- VectorVest 7 RealTime/IntraDay
- VectorVest AutoTester
- VectorVest Educational Services
- VectorVest OnLine
- VectorVest Options Analyzer
- VectorVest ProGraphics v6.0
- VectorVest ProTrader 7
- VectorVest RealTime Derby Tool
- VectorVest Simulator
- VectorVest Variator
- VectorVest Watchdog
