HOT TOPICS LIST
- MACD
- Fibonacci
- RSI
- Gann
- ADXR
- Stochastics
- Volume
- Triangles
- Futures
- Cycles
- Volatility
- ZIGZAG
- MESA
- Retracement
- Aroon
INDICATORS LIST
LIST OF TOPICS
PRINT THIS ARTICLE
by Koos van der Merwe
There is plenty of talk about gold going to new highs. What do the charts tell us?
Position: Hold
Koos van der Merwe
Has been a technical analyst since 1969, and has worked as a futures and options trader with First Financial Futures in Johannesburg, South Africa.
PRINT THIS ARTICLE
TRIANGLES
Where Are You Going, Gold?
09/14/12 09:21:06 AMby Koos van der Merwe
There is plenty of talk about gold going to new highs. What do the charts tell us?
Position: Hold
| Gold, gold, gold. That is all you hear when the bears start talking about a collapsing market. I find it interesting that economist Nouriel Roubini is saying that he only sees the US economy falling into a recession in 2016, a far cry from his "tomorrow" of yesteryear, and remarkably a date forecast by the Kondratieff wave as a minor economic correction. Because of this, the talk is to buy gold, with some even going so far as to clamor for a return to the gold standard. The latter obviously to prevent Ben Bernanke from printing US dollars indiscriminately, which to my way of thinking is okay as long as the inflation rate stays low. Nevertheless, what's in store for gold? What do the charts say? |

|
| FIGURE 1: iSHARE GOLD INDEX |
| Graphic provided by: AdvancedGET. |
| |
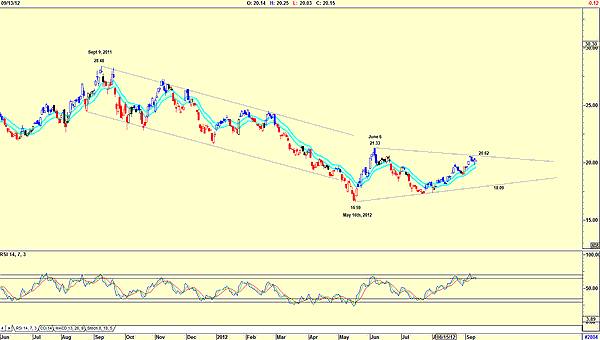
| Figure 1 is a chart of the i-Unit Gold Index trading on the Toronto Stock Exchange. The chart shows how the price has fallen from a high of $28.48 on September 9, 2011, to a low of $16.59 by May 16, 2012. The price then recovered to $21.33 by June 6 and has now formed what appears to be a descending symmetrical triangle. However, should the price rise and break above $20.62, the upper trendline, then the triangle is broken. Should the price fall to $18.09, the lower support line, and break below it, the price of XGD will fall to a target of $8.73 (28.48 - 16.59 = 11.89) (20.52 - 11.89 = 8.73). The relative strength index (RSI), which is at overbought levels, is suggesting that this is indeed a possibility. |

|
| FIGURE 2: LONDON GOLD |
| Graphic provided by: AdvancedGET. |
| |
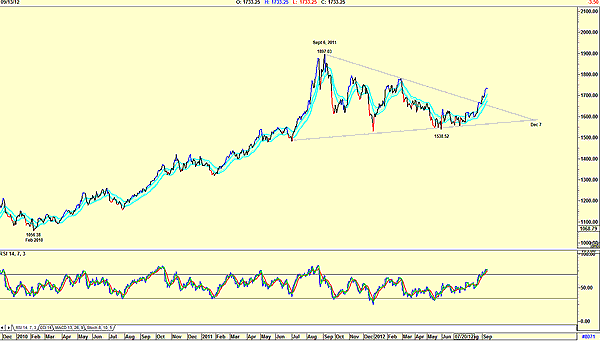
| Figure 2 is a chart of the London gold price, which is telling us just the opposite. The London gold price appears to have formed a rising symmetrical triangle and has broken out upward, suggesting a target of $2,369.17 (1,897.03 - 1,056.38 = 830.65 + 1,538.52 = 2,369.17). The RSI is, however, at overbought levels, suggesting a possible correction down in the near future. This can occur with the target of $2,369.17 still in place. Both charts in gold, the ETF gold index and the London gold price, are telling us two different things. The iShare Gold Index is suggesting a fall in the price, whereas the London gold price is suggesting a rise in the price. One thing both have in common is an overbought RSI. I would therefore look for a small correction in the gold price, followed by a strong rise to its target. The date? Well, the triangle on the London gold price is suggesting December 7, 2012. |
Has been a technical analyst since 1969, and has worked as a futures and options trader with First Financial Futures in Johannesburg, South Africa.
| Address: | 3256 West 24th Ave |
| Vancouver, BC | |
| Phone # for sales: | 6042634214 |
| E-mail address: | petroosp@gmail.com |
Click here for more information about our publications!
Comments
Date: 09/18/12Rank: 5Comment:

|

Request Information From Our Sponsors
- VectorVest, Inc.
- Executive Premier Workshop
- One-Day Options Course
- OptionsPro
- Retirement Income Workshop
- Sure-Fire Trading Systems (VectorVest, Inc.)
- Trading as a Business Workshop
- VectorVest 7 EOD
- VectorVest 7 RealTime/IntraDay
- VectorVest AutoTester
- VectorVest Educational Services
- VectorVest OnLine
- VectorVest Options Analyzer
- VectorVest ProGraphics v6.0
- VectorVest ProTrader 7
- VectorVest RealTime Derby Tool
- VectorVest Simulator
- VectorVest Variator
- VectorVest Watchdog
- StockCharts.com, Inc.
- Candle Patterns
- Candlestick Charting Explained
- Intermarket Technical Analysis
- John Murphy on Chart Analysis
- John Murphy's Chart Pattern Recognition
- John Murphy's Market Message
- MurphyExplainsMarketAnalysis-Intermarket Analysis
- MurphyExplainsMarketAnalysis-Visual Analysis
- StockCharts.com
- Technical Analysis of the Financial Markets
- The Visual Investor
