HOT TOPICS LIST
- MACD
- Fibonacci
- RSI
- Gann
- ADXR
- Stochastics
- Volume
- Triangles
- Futures
- Cycles
- Volatility
- ZIGZAG
- MESA
- Retracement
- Aroon
INDICATORS LIST
LIST OF TOPICS
PRINT THIS ARTICLE
by Donald W. Pendergast, Jr.
Shares of Visa, Inc., have enjoyed a terrific bull run since early 2009. What might be in store next for this major financial sector player's stock price?
Position: N/A
Donald W. Pendergast, Jr.
Donald W. Pendergast is a financial markets consultant who offers specialized services to stock brokers and high net worth individuals who seek a better bottom line for their portfolios.
PRINT THIS ARTICLE
CYCLES
Visa Multicycle Low Due?
09/14/12 08:42:13 AMby Donald W. Pendergast, Jr.
Shares of Visa, Inc., have enjoyed a terrific bull run since early 2009. What might be in store next for this major financial sector player's stock price?
Position: N/A
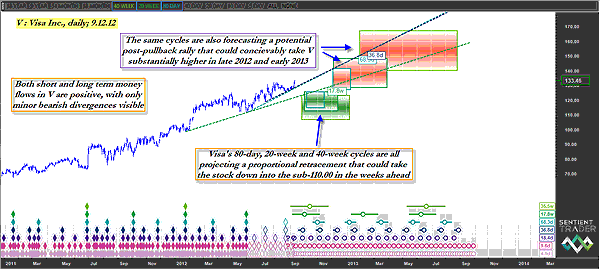
| Any stock that has been in an uptrend for nearly four years (despite a major midcycle correction in 2010) is worth a look to see what its current technical state actually is. When it comes to shares of Visa, Inc. (V), the technicals are still very positive, despite the high probability that the stock is due to start descending toward a major multicycle low sometime between late September 2012 and early January 2013. Here's a closer look at V's daily cycles chart now (Figure 1). |

|
| FIGURE 1: V, DAILY. Most all of Visa's technicals are strong, but three of its key price cycles are providing advance warning of an impending correction over the next several months. |
| Graphic provided by: MetaStock. |
| |
| Having risen by more than 215% since making its major bear market low way back in late January 2009, V's uptrend has outperformed many of its large-cap brethren in the financial sector, even including its major own correction (April to December 2010) that happened just prior to the infamous flash crash of May 2010. The stock is in the midst of a brand-new, powerful bullish breakout that has just made another multiyear high, and even the stock's short-term and long-term money flows are in excellent technical shape. As some technicians might say, "Things just couldn't get any more bullish for Visa shares right now." They may be right, at least in the near term -- especially when we see the combined time/price (TP) projections for V's 80-day, 20-week, and 40-week cycles. The green shaded boxes are the TP zones for the three distinct cycles, and they all appear to agree that V is due to make a substantial pullback and/or trend reversal sometime between late September 2012 and early January 2013. The minimum pullback price target is 125.67 and the maximum is 107.06; if the lower target is hit, that would be a 19.7% decline from the stock's recent closing price. |

|
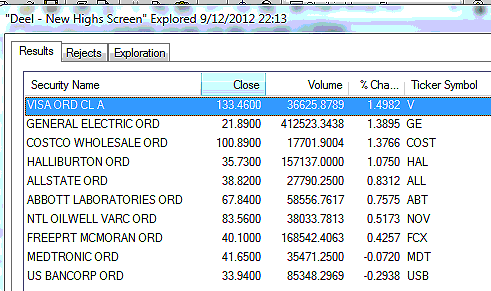
| FIGURE 2: COMPONENT STOCKS. The .OEX component stocks making new multimonth/multiyear highs on Wednesday, September 12, 2012. |
| Graphic provided by: MetaStock. |
| |
| Money flows for Visa are still very healthy, with only minor bearish divergences apparent, so it's possible that V will continue higher along with the rest of the .OEX over the next one to two weeks before its noticeable decline commences. No one really knows what the economic/political news trigger will be to get the correction going, but whatever it is, a 38% to 50% correction of the entire June through September 2012 rally is due -- a normal process that is designed to wash the excess speculation out and allow for the formation of another base from which a subsequent rally can launch. See Figure 2. |
| Existing longs in Visa shares should be running close trailing stops and or preparing to scale out of their winning positions on short notice to avoid getting crunched once the upcoming reversal or correction starts to gain strength. Long puts can also be used to protect open long positions or to provide a speculative profit opportunity on a decline; in-the-money puts are probably best for the latter scenario, with the December '12 $135 puts selling for about 7.25 and offering a reasonable bid-ask spread and an open interest figure of 592 contracts. The trendline on the chart -- the 17.8-week VTL (near 129.00) -- can be used as a de facto profit target, should Visa's anticipated decline get under way soon. Corrections and/or trend reversals sometimes begin with a sudden-shock news event, and sometimes they begin more gradually. However Visa's projected descent into the green TP zones plays out, at least we have advance warning that a major interruption of the stock's long running uptrend is very likely to occur in the near future. |
Donald W. Pendergast is a financial markets consultant who offers specialized services to stock brokers and high net worth individuals who seek a better bottom line for their portfolios.
| Title: | Writer, market consultant |
| Company: | Linear Trading Systems LLC |
| Jacksonville, FL 32217 | |
| Phone # for sales: | 904-239-9564 |
| E-mail address: | lineartradingsys@gmail.com |
Traders' Resource Links | |
| Linear Trading Systems LLC has not added any product or service information to TRADERS' RESOURCE. | |
Click here for more information about our publications!
PRINT THIS ARTICLE

|

Request Information From Our Sponsors
- StockCharts.com, Inc.
- Candle Patterns
- Candlestick Charting Explained
- Intermarket Technical Analysis
- John Murphy on Chart Analysis
- John Murphy's Chart Pattern Recognition
- John Murphy's Market Message
- MurphyExplainsMarketAnalysis-Intermarket Analysis
- MurphyExplainsMarketAnalysis-Visual Analysis
- StockCharts.com
- Technical Analysis of the Financial Markets
- The Visual Investor
- VectorVest, Inc.
- Executive Premier Workshop
- One-Day Options Course
- OptionsPro
- Retirement Income Workshop
- Sure-Fire Trading Systems (VectorVest, Inc.)
- Trading as a Business Workshop
- VectorVest 7 EOD
- VectorVest 7 RealTime/IntraDay
- VectorVest AutoTester
- VectorVest Educational Services
- VectorVest OnLine
- VectorVest Options Analyzer
- VectorVest ProGraphics v6.0
- VectorVest ProTrader 7
- VectorVest RealTime Derby Tool
- VectorVest Simulator
- VectorVest Variator
- VectorVest Watchdog
