HOT TOPICS LIST
- MACD
- Fibonacci
- RSI
- Gann
- ADXR
- Stochastics
- Volume
- Triangles
- Futures
- Cycles
- Volatility
- ZIGZAG
- MESA
- Retracement
- Aroon
INDICATORS LIST
LIST OF TOPICS
PRINT THIS ARTICLE
by Donald W. Pendergast, Jr.
The .OEX inched higher again on Wednesday, appearing ready possibly preparing to make another attempt at a new high.
Position: N/A
Donald W. Pendergast, Jr.
Donald W. Pendergast is a financial markets consultant who offers specialized services to stock brokers and high net worth individuals who seek a better bottom line for their portfolios.
PRINT THIS ARTICLE
TECHNICAL ANALYSIS
PENDY'S PICKS: September 13, 2012
09/13/12 08:57:34 AMby Donald W. Pendergast, Jr.
The .OEX inched higher again on Wednesday, appearing ready possibly preparing to make another attempt at a new high.
Position: N/A
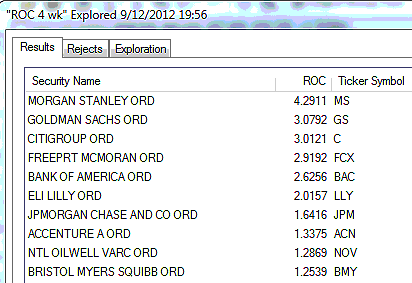
| The .OEX (Standard & Poor's 100) finished Wednesday's trading session at 659.33, closing up by 0.20%. This key large-cap index now appears to be on the verge of yet another bullish breakout, one that should peak no later than September 23, 2012. The 40-week cycle in the .OEX may have already peaked, so the next week or two in the US broad markets could be very exciting indeed. Figure 1 shows us the strongest four-week relative strength (RS) performers in the .OEX; JPMorgan Chase (JPM) has been grinding higher in a steady channel since early June 2012, but its short-term money flow histogram is hinting that this rally may not see the north side of 40.00 to 41.00 before a significant correction occurs. National Oilwell Varco (NOV) appears to have hit strong resistance just shy of 85.00 and could be ripe for a modest correction after such a strong 11-week rally. Morgan Stanley (MS) is in fine technical shape, and all money flows are strong but the stock is getting way overextended above its 21-day exponential moving average (EMA). Expect some profit taking soon and for support near 15.75 to possibly provide a bounce. |

|
| FIGURE 1: STRONGEST COMPONENTS. The 10 strongest S&P 100 (.OEX) components over the past month, as of Wednesday, September 12, 2012. |
| Graphic provided by: MetaStock. |
| Graphic provided by: MetaStock Explorer. |
| |
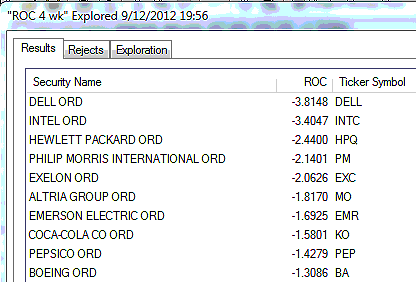
| Figure 2 is a look at the weakest four-week relative strength performers in the .OEX. Dell (DELL) may be in the initial stages of bottoming; its long-term money flow histogram is manifesting a bullish divergence with price as the stock continues to toy with the 10.50 to 10.55 area. Altria Group (MO) gapped lower on Wednesday; this stock's daily chart looks very grim from a technical perspective, and the selling is probably only getting started, given how horrific its money flows are. Pepsico (PEP) also broke sharply lower on Wednesday; 68.46 may offer the first hope for meaningful support in this consumer staples giant's share price. |

|
| FIGURE 2: WEAKEST COMPONENTS. The 10 weakest S&P 100 (.OEX) components over the past month, as of Wednesday, September 12, 2012. |
| Graphic provided by: MetaStock. |
| Graphic provided by: MetaStock Explorer. |
| |
| Figure 3 are the S&P 100 components giving overbought and/or exit signals. Four stocks gave overbought/exit signals; items of note among these signals include the double-top formation in Monsanto (MON), Johnson and Johnson (JNJ) could see a further pullback to its 21-day EMA near 67.65, and McDonald's (MCD), with its weak money flows, also looks very likely to test support near 88.00 to 89.00 soon. |

|
| FIGURE 3: OVERBOUGHT AND/OR EXIT SIGNALS. The S&P 100 (.OEX) components issuing overbought and/or exit signals at the close of trading on Wednesday, September 12, 2012; no new buy signals were issued. |
| Graphic provided by: MetaStock. |
| Graphic provided by: MetaStock Explorer. |
| |
| Among the exchange traded funds (ETFs) that Pendy's Picks follows there was one overbought/exit signal, this being in the iShares Silver Trust (SLV) (Figure 4). The wild, wide range daily price bar that SLV produced on Wednesday is either the wash-and-rinse precursor to another surge higher (perhaps a 25-30% chance of this) or the initial warning that a significant correction is about to get under way. Pendy's Picks suspects that the latter scenario is what's about to occur. |

|
| FIGURE 4: ETFS AND OVERBOUGHT/EXIT SIGNALS. The exchange traded funds issuing overbought/exit signals on Wednesday. |
| Graphic provided by: MetaStock. |
| Graphic provided by: MetaStock Explorer. |
| |
| The .OEX crept a bit higher on Wednesday, with its daily chart looking as if another bullish breakout is on the agenda soon. The 20-day and 40-day cycles in this index are due to make peaks sometime between now and September 23, 2012, so if you are still long this market you need to be monitoring your positions very closely indeed. Trade wisely until we meet here again. |
Donald W. Pendergast is a financial markets consultant who offers specialized services to stock brokers and high net worth individuals who seek a better bottom line for their portfolios.
| Title: | Writer, market consultant |
| Company: | Linear Trading Systems LLC |
| Jacksonville, FL 32217 | |
| Phone # for sales: | 904-239-9564 |
| E-mail address: | lineartradingsys@gmail.com |
Traders' Resource Links | |
| Linear Trading Systems LLC has not added any product or service information to TRADERS' RESOURCE. | |
Click here for more information about our publications!
PRINT THIS ARTICLE

Request Information From Our Sponsors
- StockCharts.com, Inc.
- Candle Patterns
- Candlestick Charting Explained
- Intermarket Technical Analysis
- John Murphy on Chart Analysis
- John Murphy's Chart Pattern Recognition
- John Murphy's Market Message
- MurphyExplainsMarketAnalysis-Intermarket Analysis
- MurphyExplainsMarketAnalysis-Visual Analysis
- StockCharts.com
- Technical Analysis of the Financial Markets
- The Visual Investor
- VectorVest, Inc.
- Executive Premier Workshop
- One-Day Options Course
- OptionsPro
- Retirement Income Workshop
- Sure-Fire Trading Systems (VectorVest, Inc.)
- Trading as a Business Workshop
- VectorVest 7 EOD
- VectorVest 7 RealTime/IntraDay
- VectorVest AutoTester
- VectorVest Educational Services
- VectorVest OnLine
- VectorVest Options Analyzer
- VectorVest ProGraphics v6.0
- VectorVest ProTrader 7
- VectorVest RealTime Derby Tool
- VectorVest Simulator
- VectorVest Variator
- VectorVest Watchdog
