HOT TOPICS LIST
- MACD
- Fibonacci
- RSI
- Gann
- ADXR
- Stochastics
- Volume
- Triangles
- Futures
- Cycles
- Volatility
- ZIGZAG
- MESA
- Retracement
- Aroon
INDICATORS LIST
LIST OF TOPICS
PRINT THIS ARTICLE
by David Penn
With the dollar declining, the CRB Index has broken out on the upside of its spring trend channel.
Position: N/A
David Penn
Technical Writer for Technical Analysis of STOCKS & COMMODITIES magazine, Working-Money.com, and Traders.com Advantage.
PRINT THIS ARTICLE
CHANNEL LINES
Commodities and Trendline Channels
07/15/02 12:26:47 PMby David Penn
With the dollar declining, the CRB Index has broken out on the upside of its spring trend channel.
Position: N/A
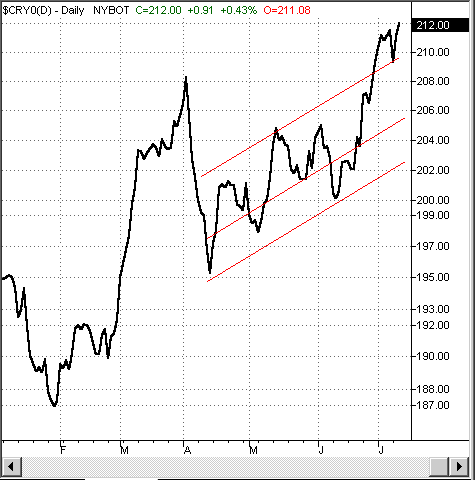
| A little over a month ago, in a Traders.com Advantage piece called "Channels Inside Channels," I compared the dramatic collapse in the U.S. Dollar Index to the spring advance of the CRB Index. In addition to providing some insight into the current economic situation in the U.S., the point of introducing the greenback was also to show again how chart patterns often beget further chart patterns. In talking about the CRB Index, I wondered whether or not the development of a higher trend channel inside a trend channel signified that higher prices (an upside breakout) was more likely than lower prices. |
| A trend channel is simply a situation in which price action can be bounded by two parallel trendlines. I suggested at the time that a breakdown through the upper trend channel into the lower trend channel could be considered a profit-taking opportunity for CRB bulls (and those long commodities in general). There was a previous breakdown into the lower channel in early May. But the quickness of the subsequent rally suggests that the lowermost trendline was likely to prove strong support during the CRB Index's advance. |

|
| Figure 1: A successful test of the middle trendline in June anticipates the successful breakout from this upward trend channel in July. |
| Graphic provided by: TradeStation. |
| |
| True enough, the CRB Index did again break down into the lower channel in early June. Yet while this breakdown was more severe (in terms of penetrating the middle trendline), the breakdown did not mark a lower low. This suggested that the upward trend in the CRB Index was still intact. Moving into mid-June, the CRB Index not only moved above the middle trend line, but also gave the trend line a quick test before moving upward toward the topmost trend line by the end of the month. This was additionally bullish for the CRB. |
7s?out above the topmost trendline in the channel comes as June moves into July. Helpfully, the CRB Index again makes a quick test of recently penetrated resistance. What is all the more positive about the CRB Index's advance in July is how the test of resistance at the top of the channel also serves as a test of the year-to-date high of 208 made at the beginning of April. |
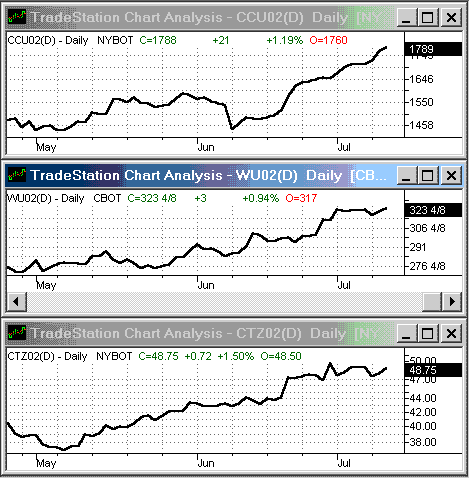
 Figure 2: Cocoa, wheat and cotton futures have all played a part in the CRB Index's early summer advance. Which commodities are responsible for the mid-June to present advance in the CRB Index? Well, as the saying goes, what have you got? September cocoa and September wheat both enjoyed strong advances, as have December cotton, corn and soybeans. Energy futures--particularly crude oil and natural gas--have been relatively tame. |
Technical Writer for Technical Analysis of STOCKS & COMMODITIES magazine, Working-Money.com, and Traders.com Advantage.
| Title: | Technical Writer |
| Company: | Technical Analysis, Inc. |
| Address: | 4757 California Avenue SW |
| Seattle, WA 98116 | |
| Phone # for sales: | 206 938 0570 |
| Fax: | 206 938 1307 |
| Website: | www.Traders.com |
| E-mail address: | DPenn@traders.com |
Traders' Resource Links | |
| Charting the Stock Market: The Wyckoff Method -- Books | |
| Working-Money.com -- Online Trading Services | |
| Traders.com Advantage -- Online Trading Services | |
| Technical Analysis of Stocks & Commodities -- Publications and Newsletters | |
| Working Money, at Working-Money.com -- Publications and Newsletters | |
| Traders.com Advantage -- Publications and Newsletters | |
| Professional Traders Starter Kit -- Software | |
Click here for more information about our publications!
Comments
Date: 07/16/02Rank: 5Comment:

Request Information From Our Sponsors
- StockCharts.com, Inc.
- Candle Patterns
- Candlestick Charting Explained
- Intermarket Technical Analysis
- John Murphy on Chart Analysis
- John Murphy's Chart Pattern Recognition
- John Murphy's Market Message
- MurphyExplainsMarketAnalysis-Intermarket Analysis
- MurphyExplainsMarketAnalysis-Visual Analysis
- StockCharts.com
- Technical Analysis of the Financial Markets
- The Visual Investor
- VectorVest, Inc.
- Executive Premier Workshop
- One-Day Options Course
- OptionsPro
- Retirement Income Workshop
- Sure-Fire Trading Systems (VectorVest, Inc.)
- Trading as a Business Workshop
- VectorVest 7 EOD
- VectorVest 7 RealTime/IntraDay
- VectorVest AutoTester
- VectorVest Educational Services
- VectorVest OnLine
- VectorVest Options Analyzer
- VectorVest ProGraphics v6.0
- VectorVest ProTrader 7
- VectorVest RealTime Derby Tool
- VectorVest Simulator
- VectorVest Variator
- VectorVest Watchdog
