

HOT TOPICS LIST
- MACD
- Fibonacci
- RSI
- Gann
- ADXR
- Stochastics
- Volume
- Triangles
- Futures
- Cycles
- Volatility
- ZIGZAG
- MESA
- Retracement
- Aroon
INDICATORS LIST
LIST OF TOPICS
PRINT THIS ARTICLE
by Donald W. Pendergast, Jr.
Shares of Freeport McMoran Copper and Gold shot higher on Friday. Does this breakout have enough firepower to advance much further before retreating?
Position: N/A
Donald W. Pendergast, Jr.
Donald W. Pendergast is a financial markets consultant who offers specialized services to stock brokers and high net worth individuals who seek a better bottom line for their portfolios.
PRINT THIS ARTICLE
BREAKOUTS
FCX Powerful Price/Volume Breakout
09/12/12 08:31:20 AMby Donald W. Pendergast, Jr.
Shares of Freeport McMoran Copper and Gold shot higher on Friday. Does this breakout have enough firepower to advance much further before retreating?
Position: N/A
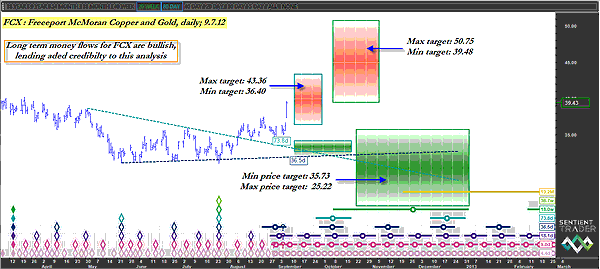
| Shares of Freeport McMoran Copper and Gold (FCX) shot higher on Friday, moving higher toward the time/price projections that two of its key price cycles have already calculated. One of the cycles, the nominal 80-day cycle (actual length of 73.8 days), is currently projecting FCX to rise as high as 43.56 sometime between September 12 and September 30, 2012. The minimum price target of 36.40 has already been exceeded, however; the massive break higher on Friday certainly does lend credibility to the possibility of the higher price target being achieved. Meanwhile, the next higher major cycle, the nominal 20-week cycle (actual length of 18 weeks), is also projecting plenty of more upside for FCX; this cycle is anticipating that this metals mining stock could make it as high as 50.75 sometime between October 7 and November 6 2012. The minimum price target for this cycle is 39.48. According to two key cycles, FCX should have a nice bullish run ahead of it for at least the next month or two; given that the short-term and long-term money flows for the stock are in bullish territory, this cyclical analysis would seem to be very much on target. See Figure 1. |
|
| FIGURE 1: FCX, DAILY. As FCX continues to rise from its major multicycle low of July 23, 2012, several cycles studies now suggest that the stock could run significantly higher over the next month or two. |
| Graphic provided by: Sentient Trader. |
| |
| Of course, once these two cycles eventually peak and turn lower, FCX then becomes liable to see a substantial corrective move -- perhaps down into the mid-$20 range by early January 2013. The large green time/price projection box (TP) on the chart is showing us where FCX's 18-week cycle is expected to bottom out after it makes its next significant cycle high; this 18-week cycle may bottom between October 22, and January 3, 2013, at a price somewhere between 25.22 and 35.73. Even though that TP window is big enough to drive an ocean liner through, the big idea here is that sound cycle studies can help provide advance warning of high-probability market moves, sometimes many months in advance. Discretionary traders stand to benefit the most from this kind of leading-edge analysis, but even traders who rely on mechanical systems can put this knowledge to good use. For example, right now such a systems trader might want to avoid taking short signals in FCX -- at least until he/she gets confirmation that the 18-week cycle has finally topped and has turned lower. |
|
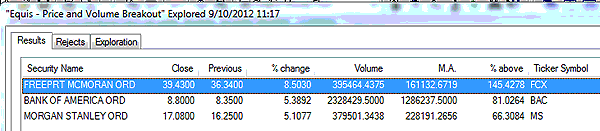
| FIGURE 2: OEX COMPONENTS. The .OEX components making major price and volume breakouts on Friday, September 7, 2012. |
| Graphic provided by: MetaStock. |
| Graphic provided by: MetaStock Explorer. |
| |
| There may be a modest pullback or two en route to the 18-week cycle high in FCX, but these can be viewed as low-risk buying opportunities; traders might want to consider a near-term October 2012 covered-call play using the $39 strike price, as these calls have a good bid-ask spread, a delta of 0.61, and an open interest of 4,748 contracts. See Figure 2. The $40 calls have more than twice the open interest (11,747 contracts), but after such a strong breakout it's usually best to stick with slightly in-the-money calls as they are less affected by minor pullbacks and can offer more confidence (and staying power) to serious covered-call traders. FCX's 21-day exponential moving average (EMA) (currently near 36.50) can be used as a simple, no-brainer trailing stop for the entire life of the position, especially given the positive 80-day and 18-week cycle forecasts previously discussed. If going the covered-call route in FCX, be sure to keep your account risk in the 1% to 2% range to help limit losses just in case the trade doesn't work as anticipated. |
Donald W. Pendergast is a financial markets consultant who offers specialized services to stock brokers and high net worth individuals who seek a better bottom line for their portfolios.
| Title: | Writer, market consultant |
| Company: | Linear Trading Systems LLC |
| Jacksonville, FL 32217 | |
| Phone # for sales: | 904-239-9564 |
| E-mail address: | lineartradingsys@gmail.com |
Traders' Resource Links | |
| Linear Trading Systems LLC has not added any product or service information to TRADERS' RESOURCE. | |
Click here for more information about our publications!
PRINT THIS ARTICLE

Request Information From Our Sponsors
- VectorVest, Inc.
- Executive Premier Workshop
- One-Day Options Course
- OptionsPro
- Retirement Income Workshop
- Sure-Fire Trading Systems (VectorVest, Inc.)
- Trading as a Business Workshop
- VectorVest 7 EOD
- VectorVest 7 RealTime/IntraDay
- VectorVest AutoTester
- VectorVest Educational Services
- VectorVest OnLine
- VectorVest Options Analyzer
- VectorVest ProGraphics v6.0
- VectorVest ProTrader 7
- VectorVest RealTime Derby Tool
- VectorVest Simulator
- VectorVest Variator
- VectorVest Watchdog
- StockCharts.com, Inc.
- Candle Patterns
- Candlestick Charting Explained
- Intermarket Technical Analysis
- John Murphy on Chart Analysis
- John Murphy's Chart Pattern Recognition
- John Murphy's Market Message
- MurphyExplainsMarketAnalysis-Intermarket Analysis
- MurphyExplainsMarketAnalysis-Visual Analysis
- StockCharts.com
- Technical Analysis of the Financial Markets
- The Visual Investor