HOT TOPICS LIST
- MACD
- Fibonacci
- RSI
- Gann
- ADXR
- Stochastics
- Volume
- Triangles
- Futures
- Cycles
- Volatility
- ZIGZAG
- MESA
- Retracement
- Aroon
INDICATORS LIST
LIST OF TOPICS
PRINT THIS ARTICLE
by Koos van der Merwe
This program to find buy signals gave a 5.4% return in July and a 6.1% return in August.
Position: Buy
Koos van der Merwe
Has been a technical analyst since 1969, and has worked as a futures and options trader with First Financial Futures in Johannesburg, South Africa.
PRINT THIS ARTICLE
ENVELOPES
Is Range Resources A Buy?
09/11/12 01:16:03 PMby Koos van der Merwe
This program to find buy signals gave a 5.4% return in July and a 6.1% return in August.
Position: Buy
| Finding a program that triggers buy/sell signals is not that easy, and then, when you think you have found a program that works, you find that more than often than not, you have to fine-tune it to meet your investment/trading style. The problem is paper trading, or running a backtest of profitability, which more often than not does not seem to work. Results are usually unreal, and you start doubting the return on investment (ROI) show. So, you decide to give it a try with real money, and then you find that the results are different than what you hoped they would be. Still, let's face it. When you get a monthly return greater than 5%, you do say, "Not bad at all." |

|
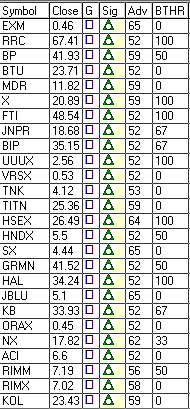
| FIGURE 1: BUYS. Buy signals given on September 7's trading. |
| Graphic provided by: OmniTrader. |
| |
| Figure 1 shows the results I received based on September 7's trading. The symbol is the ticker of the share. Close is Friday's closing price. Sig is the buy/ sell signal given. Adv is the advisor rating given by the program, and BTHR is the back test hit rate. I only look at those symbols where the BTHR is 100 and the Adv is above 52. On Friday's trading, I will only look at RRC, X,FTI,UUUX(UUU-T), HSEX(HSE-T), and HAL. Okay, so RIM is also mentioned in the list, and I will have a look at it, but a back test hit rate of 50 does discourage me. |

|
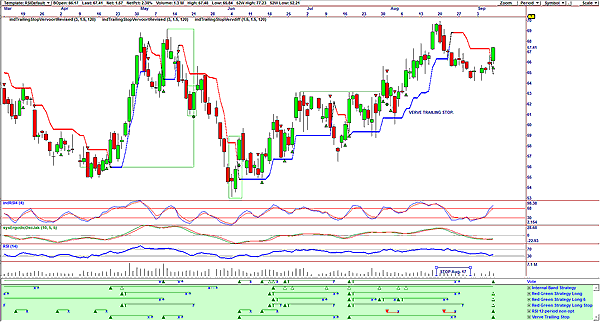
| FIGURE 2: RRC, DAILY |
| Graphic provided by: OmniTrader. |
| |
| Figure 2 is a chart of Range Resources (RRC), the first share in the list of Figure 1. The chart shows the following: 1. The vote line has given a buy signal based on all five of the strategies shown. This is a very strong plus in favor of the buy signal. 2. The share price has broken above the Verve training stop, another plus. 3. The three indicators on the chart are all looking positive. Having identified a share that looks promising, I now have a look at it in Figure 3. |

|
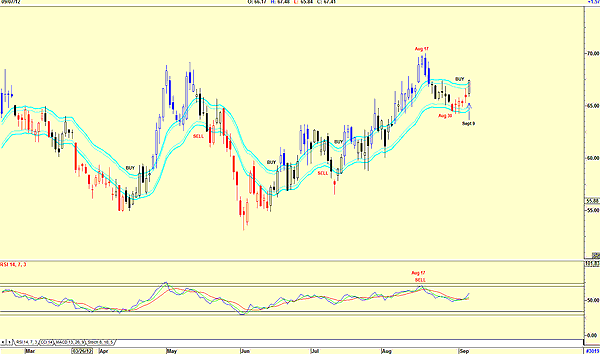
| FIGURE 3: JM INTERNAL BAND, DAILY |
| Graphic provided by: AdvancedGET. |
| |
| Figure 3 is a chart of RRC with a JM internal band and a relative strength index (RSI) 14-period indicator. A buy signal is given when the closing price of the share breaks the upper JM band, and a sell signal is given when it breaks below the lower JM band. The JM band indicator is a simple 15-period moving average offset by 2% positive and 2% negative. The chart is showing that a buy signal was given on September 9, confirming the buy signal given in Figure 1. The RSI 14-period indicator did give a sell signal on August 17 and the price dropped quickly, but on August 30, it did not penetrate the lower JM internal band line, confirming the sell signal. Although the chart in Figure 1 does suggest a sell signal earlier by a stop on August 17, but a sell signal was not given by the JM internal band. We could then have either sold the share and bought it back at a slightly lower price when the share price rose on September 4 or not sold at all, putting our trust in the JM internal band indicator. This, of course, depends on the dollar value of the commission paid for the trade. Using a program to choose stocks to purchase based on technical analysis is very important. Accepting its results simply on face value can be questionable until you are convinced that the program is working efficiently. In today's world, where many brokerage and hedge fund firms have automatic trading based on complicated algorithms, something that you are probably not experienced enough to write, finding a program or system that will do this for you is a win-win. |
Has been a technical analyst since 1969, and has worked as a futures and options trader with First Financial Futures in Johannesburg, South Africa.
| Address: | 3256 West 24th Ave |
| Vancouver, BC | |
| Phone # for sales: | 6042634214 |
| E-mail address: | petroosp@gmail.com |
Click here for more information about our publications!
PRINT THIS ARTICLE

Request Information From Our Sponsors
- StockCharts.com, Inc.
- Candle Patterns
- Candlestick Charting Explained
- Intermarket Technical Analysis
- John Murphy on Chart Analysis
- John Murphy's Chart Pattern Recognition
- John Murphy's Market Message
- MurphyExplainsMarketAnalysis-Intermarket Analysis
- MurphyExplainsMarketAnalysis-Visual Analysis
- StockCharts.com
- Technical Analysis of the Financial Markets
- The Visual Investor
- VectorVest, Inc.
- Executive Premier Workshop
- One-Day Options Course
- OptionsPro
- Retirement Income Workshop
- Sure-Fire Trading Systems (VectorVest, Inc.)
- Trading as a Business Workshop
- VectorVest 7 EOD
- VectorVest 7 RealTime/IntraDay
- VectorVest AutoTester
- VectorVest Educational Services
- VectorVest OnLine
- VectorVest Options Analyzer
- VectorVest ProGraphics v6.0
- VectorVest ProTrader 7
- VectorVest RealTime Derby Tool
- VectorVest Simulator
- VectorVest Variator
- VectorVest Watchdog
