HOT TOPICS LIST
- MACD
- Fibonacci
- RSI
- Gann
- ADXR
- Stochastics
- Volume
- Triangles
- Futures
- Cycles
- Volatility
- ZIGZAG
- MESA
- Retracement
- Aroon
INDICATORS LIST
LIST OF TOPICS
PRINT THIS ARTICLE
by Koos van der Merwe
Discussing the economy today is all politics. This is influencing constructive analysis.
Position: Accumulate
Koos van der Merwe
Has been a technical analyst since 1969, and has worked as a futures and options trader with First Financial Futures in Johannesburg, South Africa.
PRINT THIS ARTICLE
ELLIOTT WAVE
Another Look At Starbucks
09/10/12 08:49:00 AMby Koos van der Merwe
Discussing the economy today is all politics. This is influencing constructive analysis.
Position: Accumulate
| With the Presidential election in two months' time, any discussion of a possible economic recovery brings politics into the discussion. So, looking for a stock or indicator that those investors clever enough not to be influenced by political discussion are buying is a challenge. Having been in the retail business for over 30 years, one thing I learned is to count the number of people who walk into a store. A business that has a lineup of customers waiting to buy is a very positive sign, and this is what I see whenever I walk into a Starbucks. There is always a crowd of people waiting to be served by highly efficient staff. Is this a sign of an economy that is recovering? |

|
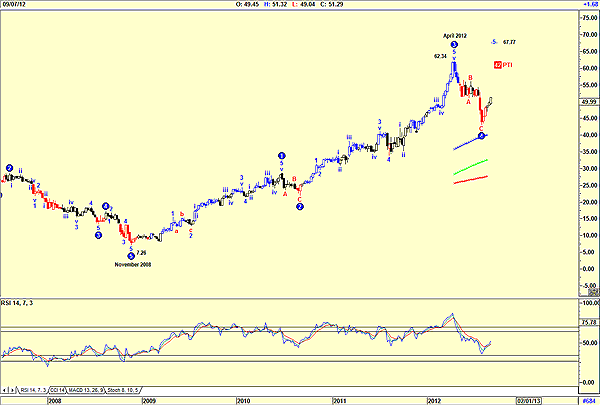
| FIGURE 1: AMZN, WEEKLY |
| Graphic provided by: AdvancedGET. |
| |
| Figure 1 is a long-term weekly chart of Starbucks, showing how the share price recovered from a low of $7.26 in November 2008 to a high of $62.34 in April 2012. We all know why this occurred. It was because of the genius of Howard Schultz, the founder of Starbucks, taking the reins once more. The Elliott wave count is suggesting that share price has completed a wave 4 correction, and is now in a wave 1 of wave 5 with a target of $67.77. The PTI (probability index) is 42, suggesting that this rise into wave 5 is very much on the cards. |

|
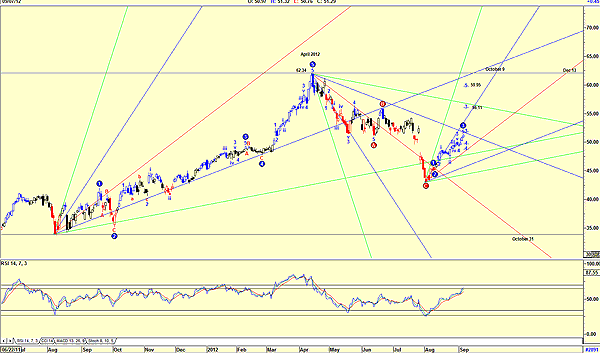
| FIGURE 2: AMZN, DAILY |
| Graphic provided by: AdvancedGET. |
| |
| The daily chart in Figure 2 shows the Advanced GET Elliott wave targets of $56.11 and $59.95. The Gann fan (0.2) is suggesting a date of October 9 for this target with a correction to follow. The relative strength index (RSI) is approaching overbought levels, suggesting that this target and date is indeed possible. The date of October 31 shown on the chart is suggesting the date of the recovery should the correction occur as expected. This wave count would be wave 1 of a new bull market. Are customers buying Starbucks coffee hoping that the caffeine lift will boost them out of a depression (not financial but emotional) or are they supporting Starbucks en masse because the depression (financial) is lifting. The chart is definitely suggesting the latter. |
Has been a technical analyst since 1969, and has worked as a futures and options trader with First Financial Futures in Johannesburg, South Africa.
| Address: | 3256 West 24th Ave |
| Vancouver, BC | |
| Phone # for sales: | 6042634214 |
| E-mail address: | petroosp@gmail.com |
Click here for more information about our publications!
PRINT THIS ARTICLE

Request Information From Our Sponsors
- VectorVest, Inc.
- Executive Premier Workshop
- One-Day Options Course
- OptionsPro
- Retirement Income Workshop
- Sure-Fire Trading Systems (VectorVest, Inc.)
- Trading as a Business Workshop
- VectorVest 7 EOD
- VectorVest 7 RealTime/IntraDay
- VectorVest AutoTester
- VectorVest Educational Services
- VectorVest OnLine
- VectorVest Options Analyzer
- VectorVest ProGraphics v6.0
- VectorVest ProTrader 7
- VectorVest RealTime Derby Tool
- VectorVest Simulator
- VectorVest Variator
- VectorVest Watchdog
- StockCharts.com, Inc.
- Candle Patterns
- Candlestick Charting Explained
- Intermarket Technical Analysis
- John Murphy on Chart Analysis
- John Murphy's Chart Pattern Recognition
- John Murphy's Market Message
- MurphyExplainsMarketAnalysis-Intermarket Analysis
- MurphyExplainsMarketAnalysis-Visual Analysis
- StockCharts.com
- Technical Analysis of the Financial Markets
- The Visual Investor
