HOT TOPICS LIST
- MACD
- Fibonacci
- RSI
- Gann
- ADXR
- Stochastics
- Volume
- Triangles
- Futures
- Cycles
- Volatility
- ZIGZAG
- MESA
- Retracement
- Aroon
INDICATORS LIST
LIST OF TOPICS
PRINT THIS ARTICLE
by David Penn
Upside triangle breakouts send September wheat on a summer rally.
Position: N/A
David Penn
Technical Writer for Technical Analysis of STOCKS & COMMODITIES magazine, Working-Money.com, and Traders.com Advantage.
PRINT THIS ARTICLE
TRIANGLES
The Triangles of September Wheat
07/11/02 09:05:24 AMby David Penn
Upside triangle breakouts send September wheat on a summer rally.
Position: N/A
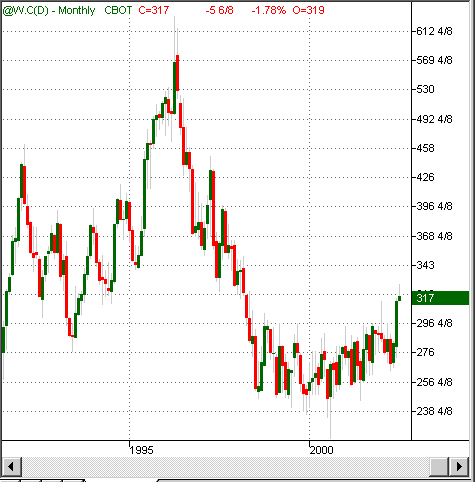
| Those who pooh-poohed the notion of deflation and its effect on commodities prices in the second half of the 1990s should be chastened by markets like wheat, which followed a 58% drop from the spring of 1996 to the summer of 1998 with a four-year consolidation range between, roughly, $3 and $2.50 that has lasted up until only recently. However, given the surprising rally in wheat prices this summer, wheat-watchers are drawn to wonder: could wheat have finally put in a bottom and be on its way back up again? Although stuck in a range since 1998, wheat's price range has been somewhat bowl-shaped and the steadily higher lows on the right side of this "bowl" appear to underscore the case for if not a new bull market then at lest the end of the bear. |
| The case for a bull market in wheat comes from wheat's explosive advance in the early summer of 2002. Note how the upmove in wheat makes a close above the major resistance level of 296 (no monthly closes above this level since the spring of 1998). |

|
| Figure 1: Recent advances in wheat come on the heels of a four-year consolidation bottom. |
| Graphic provided by: TradeStation. |
| |
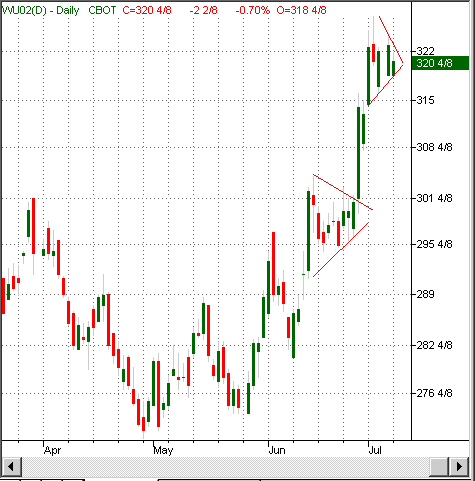
| Let's take a closer look at wheat's summer rally through the lens of the September wheat contract. What is most striking about the advance is the way that wheat prices consolidated into a symmetrical triangle formation in the second half of June, a symmetrical triangle that led directly to the upside breakout. |
 Figure 2: Does one good upside triangle breakout deserve another? The uptrend in September wheat is in the hands of a second symmetrical triangle. This is almost a perfect example of a symmetrical triangle as a continuation formation. Although symmetrical triangles are often spotted as tops and bottoms, triangles in general are quite often accumulation/distribution areas in trends--as is the case here. Note the two sloping, converging trendlines that mark the lower highs and higher lows in September wheat prices during June. The measurement rule for symmetrical triangles is common sense: take the formation height from highest high (307) to lowest low (292), and add that value to the highest high for an upside breakout, or subtract that value from the lowest low for a breakdown. Here, once prices penetrate the topmost trendline (resistance) an upside target of about 322 can be established. Including the breakout day as day one, the price target is reached in three days. Assuming an entry price of around 304, a long breakout trade could have easily netted 18 cents or $900 per contract. |
| Interestingly, September wheat has entered into another symmetrical triangle in July. This triangle presents two main possibilities (excluding a third, of course, that prices will consolidate here and go nowhere soon). The first possibility is that this symmetrical triangle, like the previous one, will be a continuation formation that takes September wheat up to a test of the 340 area, which represented resistance for the first quarter of 1998. The second possibility is that the triangle will break down, sending wheat prices back toward the support area around the top of the previous, June symmetrical triangle. Waiting for any break to move beyond the triangle's own support (bottom of formation) or resistance (top of formation) will be key to seizing any sizable gains that may result from a powerful break in either direction. |
Technical Writer for Technical Analysis of STOCKS & COMMODITIES magazine, Working-Money.com, and Traders.com Advantage.
| Title: | Technical Writer |
| Company: | Technical Analysis, Inc. |
| Address: | 4757 California Avenue SW |
| Seattle, WA 98116 | |
| Phone # for sales: | 206 938 0570 |
| Fax: | 206 938 1307 |
| Website: | www.Traders.com |
| E-mail address: | DPenn@traders.com |
Traders' Resource Links | |
| Charting the Stock Market: The Wyckoff Method -- Books | |
| Working-Money.com -- Online Trading Services | |
| Traders.com Advantage -- Online Trading Services | |
| Technical Analysis of Stocks & Commodities -- Publications and Newsletters | |
| Working Money, at Working-Money.com -- Publications and Newsletters | |
| Traders.com Advantage -- Publications and Newsletters | |
| Professional Traders Starter Kit -- Software | |
Click here for more information about our publications!
PRINT THIS ARTICLE

Request Information From Our Sponsors
- VectorVest, Inc.
- Executive Premier Workshop
- One-Day Options Course
- OptionsPro
- Retirement Income Workshop
- Sure-Fire Trading Systems (VectorVest, Inc.)
- Trading as a Business Workshop
- VectorVest 7 EOD
- VectorVest 7 RealTime/IntraDay
- VectorVest AutoTester
- VectorVest Educational Services
- VectorVest OnLine
- VectorVest Options Analyzer
- VectorVest ProGraphics v6.0
- VectorVest ProTrader 7
- VectorVest RealTime Derby Tool
- VectorVest Simulator
- VectorVest Variator
- VectorVest Watchdog
- StockCharts.com, Inc.
- Candle Patterns
- Candlestick Charting Explained
- Intermarket Technical Analysis
- John Murphy on Chart Analysis
- John Murphy's Chart Pattern Recognition
- John Murphy's Market Message
- MurphyExplainsMarketAnalysis-Intermarket Analysis
- MurphyExplainsMarketAnalysis-Visual Analysis
- StockCharts.com
- Technical Analysis of the Financial Markets
- The Visual Investor
