HOT TOPICS LIST
- MACD
- Fibonacci
- RSI
- Gann
- ADXR
- Stochastics
- Volume
- Triangles
- Futures
- Cycles
- Volatility
- ZIGZAG
- MESA
- Retracement
- Aroon
INDICATORS LIST
LIST OF TOPICS
PRINT THIS ARTICLE
by Billy Williams
The market is trading like the eye of a storm -- calm and quiet -- but a typhoon of trading could be right around the corner, along with big profits.
Position: Hold
Billy Williams
Billy Williams has been trading the markets for 27 years, specializing in momentum trading with stocks and options.
PRINT THIS ARTICLE
TECHNICAL ANALYSIS
The Market As The Eye Of The Storm
09/06/12 11:12:06 AMby Billy Williams
The market is trading like the eye of a storm -- calm and quiet -- but a typhoon of trading could be right around the corner, along with big profits.
Position: Hold
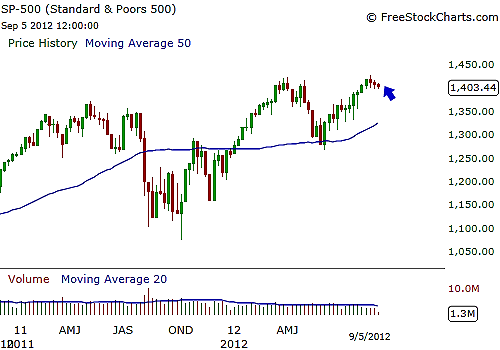
| For the last month, the SPX has been trading back and forth in a tight range, since neither side -- bulls or bears -- have been able to take control of the trend. This period of contraction has kept the market locked in place with no catalyst to cause enough buying or selling en masse to force price into a tightly defined trading range. This trading range has whipsawed smaller, inexperienced traders back and forth, forcing many to take unnecessary losses while more experienced traders have had the tools to take bite-sized profits out of the market. However, the good news is that the contracted price range could be setting the stage for the market to break free and, possibly, move to higher ground, sparking a new secular bull market. On the weekly chart, the last four price bars of the SPX reveal four consecutive closes that are within almost 1% of each other. This is a four-week-high tight pattern, which is a strong indicator of bullish conditions that are forming in the overall market and that, if triggered, will bleed through to the rest of the stock sectors that have resisted the downward pressure by the bulls and help them break free to higher ground. See Figure 1. If the bull run is confirmed and price begins its ascent from the weekly charts, it could mean a long-lasting uptrend, since price is breaking higher from a long-term time frame. |

|
| FIGURE 1: SPX, WEEKLY. On the weekly chart, a big bullish sign formed as a four-week-high tight pattern was formed as the last four trading periods closed within a 1% range. |
| Graphic provided by: www.freestockcharts.com. |
| |
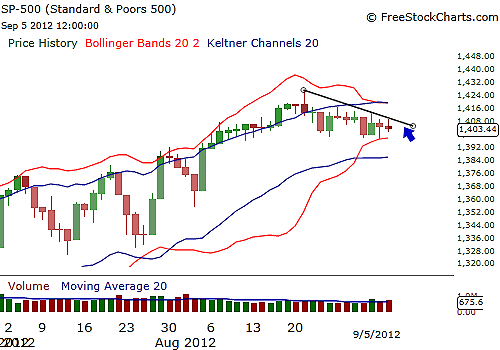
| Chunking down to the daily chart, the SPX's contracted range become apparent on a shorter-term time frame by overlaying the Bollinger Bands and the Keltner channels over the price action. Bollinger Bands are a volatility-based indicator that reveals the median volatility level and the upper and lower volatility that is one, or more, standard deviations away from the mean. The underlying premise of this indicator is that extreme volatility always reverts to the mean, so when price reached the upper or lower volatility bands, it will have a bias to return to the mean or the median moving average, in this case. The Keltner channels are based on the price action itself and represent the average, close, and open price ranges in the last 20 trading periods times the average true range of 1.5. These calculations give you a visual representation of the average price range. See Figure 2. |

|
| FIGURE 2: SPX. On the daily charts, price was squeezed as the Bollinger Bands traded within the Keltner channels, setting the condition for a potential explosive bull run. |
| Graphic provided by: www.freestockcharts.com. |
| |
| Combined, they form a strong indicator, revealing to you that price becomes squeezed in a contracted price range when the Bollinger Bands contract within the Keltner channels and show that volatility is falling and trading within the SPX's average price range. Since higher volatility follows low volatility, such a price setup signals that a strong price move is likely to occur, and when it does, it tends to be explosive. |
| Right now, the combination of a weekly four-week-high tight pattern and a daily squeeze on the SPX indicates that a strong move is likely to occur in the next few weeks. But that doesn't mean you should take a position right away. It's better to wait till the move is confirmed. For now, watch your list of stock leaders and look for any strong price action along with any increase in trading volume. If you see a stock beginning to break higher and you are aggressive, you might try to anticipate the move early as long as you protect yourself with good risk control. But if you are more conservative, you might be better off waiting until the bull run is confirmed before making any entries or waiting to trade on a pullback rather than chase a breakout. |
Billy Williams has been trading the markets for 27 years, specializing in momentum trading with stocks and options.
| Company: | StockOptionSystem.com |
| E-mail address: | stockoptionsystem.com@gmail.com |
Traders' Resource Links | |
| StockOptionSystem.com has not added any product or service information to TRADERS' RESOURCE. | |
Click here for more information about our publications!
Comments
Date: 09/12/12Rank: 3Comment:

Request Information From Our Sponsors
- StockCharts.com, Inc.
- Candle Patterns
- Candlestick Charting Explained
- Intermarket Technical Analysis
- John Murphy on Chart Analysis
- John Murphy's Chart Pattern Recognition
- John Murphy's Market Message
- MurphyExplainsMarketAnalysis-Intermarket Analysis
- MurphyExplainsMarketAnalysis-Visual Analysis
- StockCharts.com
- Technical Analysis of the Financial Markets
- The Visual Investor
- VectorVest, Inc.
- Executive Premier Workshop
- One-Day Options Course
- OptionsPro
- Retirement Income Workshop
- Sure-Fire Trading Systems (VectorVest, Inc.)
- Trading as a Business Workshop
- VectorVest 7 EOD
- VectorVest 7 RealTime/IntraDay
- VectorVest AutoTester
- VectorVest Educational Services
- VectorVest OnLine
- VectorVest Options Analyzer
- VectorVest ProGraphics v6.0
- VectorVest ProTrader 7
- VectorVest RealTime Derby Tool
- VectorVest Simulator
- VectorVest Variator
- VectorVest Watchdog
