HOT TOPICS LIST
- MACD
- Fibonacci
- RSI
- Gann
- ADXR
- Stochastics
- Volume
- Triangles
- Futures
- Cycles
- Volatility
- ZIGZAG
- MESA
- Retracement
- Aroon
INDICATORS LIST
LIST OF TOPICS
PRINT THIS ARTICLE
by Donald W. Pendergast, Jr.
Since putting in a double bottom this summer, Morgan Stanley shares have rebounded nicely; is a pullback due now that Fibonacci resistance has manifested?
Position: N/A
Donald W. Pendergast, Jr.
Donald W. Pendergast is a financial markets consultant who offers specialized services to stock brokers and high net worth individuals who seek a better bottom line for their portfolios.
PRINT THIS ARTICLE
BREAKOUTS
Is A Morgan Stanley Pullback Due?
09/06/12 08:17:21 AMby Donald W. Pendergast, Jr.
Since putting in a double bottom this summer, Morgan Stanley shares have rebounded nicely; is a pullback due now that Fibonacci resistance has manifested?
Position: N/A
| Although Morgan Stanley's (MS) stock prices in the $70-plus range may not be seen again for a long time, the shares are still well suited for short-term traders and swing traders. Here's a closer look. |

|
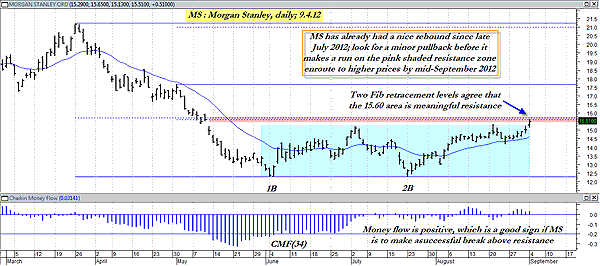
| FIGURE 1: MS, DAILY. If MS makes a pullback to its 21-day EMA, traders may wish to enter a long trade on a break above the stock's most recent high. The stock is due to make a significant cycle peak within the next 10 to 17 days. |
| Graphic provided by: MetaStock. |
| |
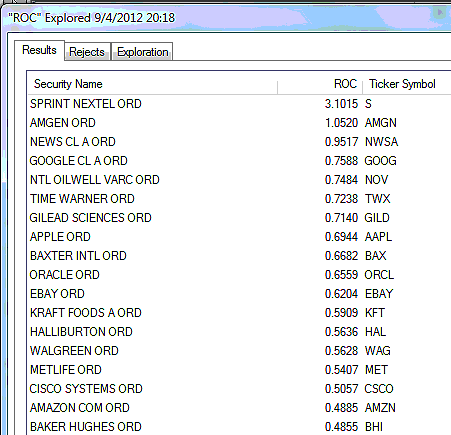
| Morgan Stanley shares enjoyed terrific rallies in the 1990s and then again from late 2002 to June 2007. Each massive rally was followed by a truly incredible plunge, with the drop in share prices from late 2007 to late 2008 of mind-shattering proportions -- that is, if you believe a 90% drop in a major large-cap stock qualifies for such a descriptive term. See Figure 1. MS is up by more than 30% from its major July 23, 2012, low (which was the second low in a confirmed double-bottom pattern) and really does look like it may be able to stay above the recent three-month-long consolidation pattern it had been trapped in (see the blue shaded rectangle on chart), especially since its 34-period Chaikin money flow histogram (CMF)(34) is still in bullish territory. However, the stock has just hit a key Fibonacci confluence zone formed by the 38% retracement of one major swing and the 62% retracement of a slightly lesser swing (pink horizontal line on chart) in the 15.50-15.60 area. The price cycles in MS are generally bullish and are similar to those seen in the .OEX's nominal 40- and 80-day cycles, so there is a strong probability that MS will also attempt to surge higher one more time in September, likely making a multicycle high sometime in mid- to late September. See Figure 2. |

|
| FIGURE 2: LARGE-CAP STOCKS. A list of large-cap stocks that are outperforming the .OEX over the past 13 weeks. |
| Graphic provided by: MetaStock. |
| Graphic provided by: MetaStock Explorer. |
| |
| The big picture chart pattern we see here in Figure 1 is also known as a triple-top buy. Technically, the recent break higher is a success, but there is also a very strong chance that MS will pull back toward its 21-day exponential moving average (EMA), which is currently at 14.65. A pullback to this EMA, followed by a quick reversal, would be the tipoff that MS intends to make a strong move now, with its dominant price cycles paving the way for another $2 to $3 gain by the latter half of September. While it might be tempting to latch onto a covered-call play in MS now, it's actually riskier than just going the all-stock route, unless you use deep in-the-money calls that aren't going to make you all that much money anyway, despite being less risky than out-of-the-money or at-the-money call options. Remember, the best time to put on covered-call trades is when the broad market starts on a new, confirmed uptrend after a major correction and not at the tail end of a three-month-plus rally that may be over within two weeks. |
| One way to play MS here is as follows: Wait for a pullback and then place a buy-stop order just above Tuesday's high of 15.61. If filled, trail a two-bar trail of the daily lows until the trade finally stops out. If you get a fast move higher (more than $1 in one session) right out the gate, consider taking partial profits and letting the rest of the trade run until the final stopout. Risk no more than 2% of your account equity on such a trade and be cautious if the trade is still open by the third week of this month, as that's when MS is most vulnerable to a significant correction. Its key 40-day and 80-day cycles will be turning lower by then, and you definitely want to be out of the stock market pool before the lightning strikes. |
Donald W. Pendergast is a financial markets consultant who offers specialized services to stock brokers and high net worth individuals who seek a better bottom line for their portfolios.
| Title: | Writer, market consultant |
| Company: | Linear Trading Systems LLC |
| Jacksonville, FL 32217 | |
| Phone # for sales: | 904-239-9564 |
| E-mail address: | lineartradingsys@gmail.com |
Traders' Resource Links | |
| Linear Trading Systems LLC has not added any product or service information to TRADERS' RESOURCE. | |
Click here for more information about our publications!
PRINT THIS ARTICLE

Request Information From Our Sponsors
- StockCharts.com, Inc.
- Candle Patterns
- Candlestick Charting Explained
- Intermarket Technical Analysis
- John Murphy on Chart Analysis
- John Murphy's Chart Pattern Recognition
- John Murphy's Market Message
- MurphyExplainsMarketAnalysis-Intermarket Analysis
- MurphyExplainsMarketAnalysis-Visual Analysis
- StockCharts.com
- Technical Analysis of the Financial Markets
- The Visual Investor
- VectorVest, Inc.
- Executive Premier Workshop
- One-Day Options Course
- OptionsPro
- Retirement Income Workshop
- Sure-Fire Trading Systems (VectorVest, Inc.)
- Trading as a Business Workshop
- VectorVest 7 EOD
- VectorVest 7 RealTime/IntraDay
- VectorVest AutoTester
- VectorVest Educational Services
- VectorVest OnLine
- VectorVest Options Analyzer
- VectorVest ProGraphics v6.0
- VectorVest ProTrader 7
- VectorVest RealTime Derby Tool
- VectorVest Simulator
- VectorVest Variator
- VectorVest Watchdog
