HOT TOPICS LIST
- MACD
- Fibonacci
- RSI
- Gann
- ADXR
- Stochastics
- Volume
- Triangles
- Futures
- Cycles
- Volatility
- ZIGZAG
- MESA
- Retracement
- Aroon
INDICATORS LIST
LIST OF TOPICS
PRINT THIS ARTICLE
by Gary Grosschadl
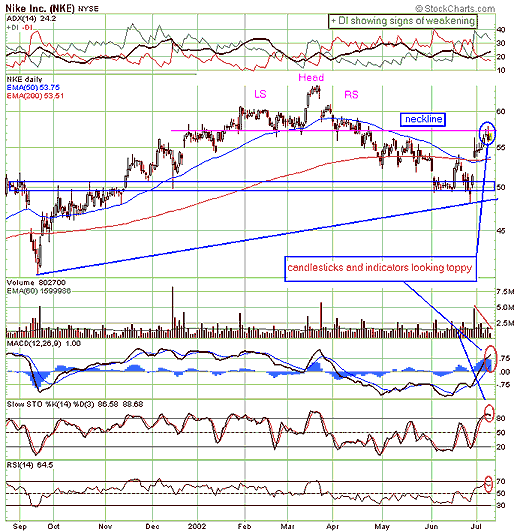
NIKE deteriorated in the spring as it came off a head and shoulders top and recently has found its second wind.
Position: N/A
Gary Grosschadl
Independent Canadian equities trader and technical analyst based in Peterborough
Ontario, Canada.
PRINT THIS ARTICLE
CHART ANALYSIS
NIKE Making A Run For It, But Could Be Out Of Gas
07/12/02 10:30:32 AMby Gary Grosschadl
NIKE deteriorated in the spring as it came off a head and shoulders top and recently has found its second wind.
Position: N/A
| It's made a classic pullback move to the neckline of the previous head and shoulders topping pattern but this can often serve as powerful resistance that brings the stock back down again. We can already see early hints of failure. Recent candlesticks have long upper shadows showing weakening conviction by the bulls and this is confirmed by weakening volume. Observant traders will also have noticed a "doji rally killer" signal. This often occurs when a doji candlestick appears after an extended rally -- a topping warning. Having this occur at the previously mentioned neckline makes this more ominous. |
| The displayed indicators are also looking rather toppy, especially the stochastics which is in an overbought zone and starting a bearish turn down. Looking at the directional movement indicator we see that the ADX line is still bullishly upsloping and properly between the DI lines but the +DI is showing early signs of weakening. |

|
| Graphic provided by: stockcharts.com. |
| |
| In the short term it is very likely that NIKE will go through a retracement to previous support levels. The first support may come from the previous congestion zone around $55, but more likely it will test support at the more crucial 200-day EMA currently sitting at 53.50. Failure here may drop it to the next significant congestion zone at the $50 level. |
| A bullish advance above the neckline area negates the bearish view. In summary, the crucial areas to watch are the neckline resistance and the 200-day EMA possible support. Failure or success at these points may produce trading opportunities for the short term trader. Longer term traders will also want to watch direction here at this crucial moving average zone as the stock tries to make a trend change. There is a chance that a bearish move below the 200-day EMA could result in a move to test the lower trendline at the $49 level. |
Independent Canadian equities trader and technical analyst based in Peterborough
Ontario, Canada.
| Website: | www.whatsonsale.ca/financial.html |
| E-mail address: | gwg7@sympatico.ca |
Click here for more information about our publications!
PRINT THIS ARTICLE

Request Information From Our Sponsors
- StockCharts.com, Inc.
- Candle Patterns
- Candlestick Charting Explained
- Intermarket Technical Analysis
- John Murphy on Chart Analysis
- John Murphy's Chart Pattern Recognition
- John Murphy's Market Message
- MurphyExplainsMarketAnalysis-Intermarket Analysis
- MurphyExplainsMarketAnalysis-Visual Analysis
- StockCharts.com
- Technical Analysis of the Financial Markets
- The Visual Investor
- VectorVest, Inc.
- Executive Premier Workshop
- One-Day Options Course
- OptionsPro
- Retirement Income Workshop
- Sure-Fire Trading Systems (VectorVest, Inc.)
- Trading as a Business Workshop
- VectorVest 7 EOD
- VectorVest 7 RealTime/IntraDay
- VectorVest AutoTester
- VectorVest Educational Services
- VectorVest OnLine
- VectorVest Options Analyzer
- VectorVest ProGraphics v6.0
- VectorVest ProTrader 7
- VectorVest RealTime Derby Tool
- VectorVest Simulator
- VectorVest Variator
- VectorVest Watchdog
