HOT TOPICS LIST
- MACD
- Fibonacci
- RSI
- Gann
- ADXR
- Stochastics
- Volume
- Triangles
- Futures
- Cycles
- Volatility
- ZIGZAG
- MESA
- Retracement
- Aroon
INDICATORS LIST
LIST OF TOPICS
PRINT THIS ARTICLE
by Koos van der Merwe
Amazon has recently been testing the $250 level, a new all-time high.
Position: Sell
Koos van der Merwe
Has been a technical analyst since 1969, and has worked as a futures and options trader with First Financial Futures in Johannesburg, South Africa.
PRINT THIS ARTICLE
ELLIOTT WAVE
Is Amazon Due For A Correction?
09/04/12 09:29:19 AMby Koos van der Merwe
Amazon has recently been testing the $250 level, a new all-time high.
Position: Sell
| With the company projected to earn less than $1 a share in 2012, Amazon (AMZN) has understandably been targeted by numerous bears as a monster short opportunity. Investors who have shorted the stock have not been rewarded thus far, so what are the chances that they will be rewarded if they short the stock now? |

|
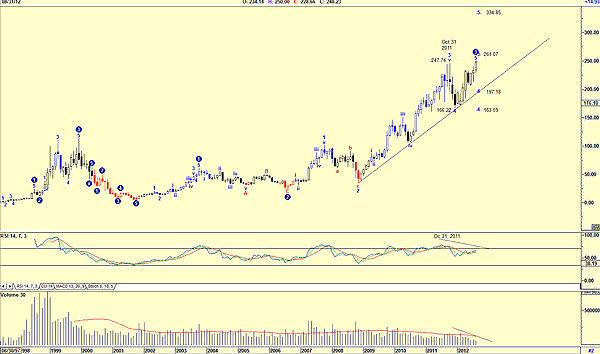
| FIGURE 1: AMZN, MONTHLY |
| Graphic provided by: AdvancedGET. |
| |
| Figure 1 is a monthly chart of AMZN and shows the following: a. An Elliott wave count that suggests that the share price is due for a fourth-wave correction, with a possible target of either $197.18 or $163.59. The chart is also suggesting that wave 5 of wave 3 is not complete, and the share price could rise to the $261.07 level before the start of the correction. b. The chart is showing that the relative strength index (RSI) gave a sell signal on October 31, 2011, when the price tested the $247.72 level. The share price dropped in a wave 4 of wave 3, testing the support line at $166.22 before rising into wave 5 of wave 3. Since then, the RSI has risen and could possibly give a divergence sell signal, should it start turning down. c. Also note how volume started to fall as the price rose, a strong sign of weakness. |

|
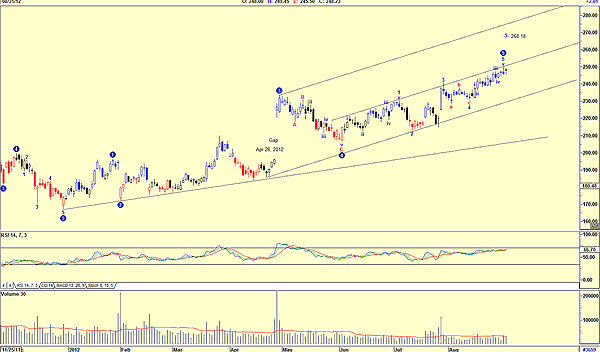
| FIGURE 2: AMZN, DAILY |
| Graphic provided by: AdvancedGET. |
| |
| The daily chart in Figure 2 shows the gap of April 26, 2012. The price did drop in a wave 4 to fill the gap; what it suggests is a wave 5. There was no Elliott wave count leading to the gap, which is disturbing. This does put the wave count shown on the chart in doubt, but until a new wave count appears obvious, we will accept the one shown, 268.18. The support and resistance lines do suggest that the share price is due for a correction; however, with the RSI below the 70 horizontal line, the possibility of another rise is very much on the cards. Volume is below average. The Elliott wave daily chart of Amazon is not simple and therefore does not obey the first rule of Elliott wave analysis. However, with the RSI at present levels and with the price testing the upper resistance line, I would be very cautious of buying Amazon at present levels. A correction as suggested by the fundamentalists does look as though it may very well happen, and soon. |
Has been a technical analyst since 1969, and has worked as a futures and options trader with First Financial Futures in Johannesburg, South Africa.
| Address: | 3256 West 24th Ave |
| Vancouver, BC | |
| Phone # for sales: | 6042634214 |
| E-mail address: | petroosp@gmail.com |
Click here for more information about our publications!
PRINT THIS ARTICLE

Request Information From Our Sponsors
- StockCharts.com, Inc.
- Candle Patterns
- Candlestick Charting Explained
- Intermarket Technical Analysis
- John Murphy on Chart Analysis
- John Murphy's Chart Pattern Recognition
- John Murphy's Market Message
- MurphyExplainsMarketAnalysis-Intermarket Analysis
- MurphyExplainsMarketAnalysis-Visual Analysis
- StockCharts.com
- Technical Analysis of the Financial Markets
- The Visual Investor
- VectorVest, Inc.
- Executive Premier Workshop
- One-Day Options Course
- OptionsPro
- Retirement Income Workshop
- Sure-Fire Trading Systems (VectorVest, Inc.)
- Trading as a Business Workshop
- VectorVest 7 EOD
- VectorVest 7 RealTime/IntraDay
- VectorVest AutoTester
- VectorVest Educational Services
- VectorVest OnLine
- VectorVest Options Analyzer
- VectorVest ProGraphics v6.0
- VectorVest ProTrader 7
- VectorVest RealTime Derby Tool
- VectorVest Simulator
- VectorVest Variator
- VectorVest Watchdog
