HOT TOPICS LIST
- MACD
- Fibonacci
- RSI
- Gann
- ADXR
- Stochastics
- Volume
- Triangles
- Futures
- Cycles
- Volatility
- ZIGZAG
- MESA
- Retracement
- Aroon
INDICATORS LIST
LIST OF TOPICS
PRINT THIS ARTICLE
by Donald W. Pendergast, Jr.
While it's almost impossible to determine if a simple pullback is actually the precursor to a major trend reversal, there are some useful technical tools that can help eliminate some confusion.
Position: N/A
Donald W. Pendergast, Jr.
Donald W. Pendergast is a financial markets consultant who offers specialized services to stock brokers and high net worth individuals who seek a better bottom line for their portfolios.
PRINT THIS ARTICLE
REVERSAL
Halliburton Pullback Or Trend Reversal?
09/05/12 11:43:48 AMby Donald W. Pendergast, Jr.
While it's almost impossible to determine if a simple pullback is actually the precursor to a major trend reversal, there are some useful technical tools that can help eliminate some confusion.
Position: N/A
| Shares of Halliburton Co. (HAL) enjoyed a tremendous eight-week rally, up by 35% between late June-late August 2012. Is the stock's current decline a simple pullback, or is it the start of a major trend reversal? Here's a closer look now. |

|
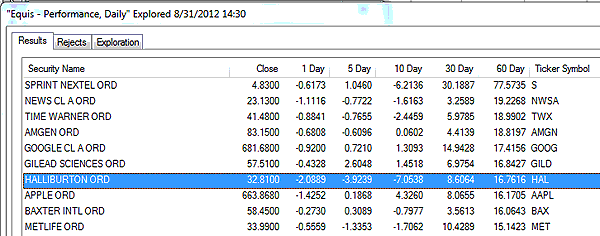
| FIGURE 1: COMPONENT STOCKS. The S&P 100 component stocks, ranked according to their most recent 60-day percentage gain/loss. The best performers are at the top. |
| Graphic provided by: MetaStock. |
| Graphic provided by: MetaStock Explorer. |
| |
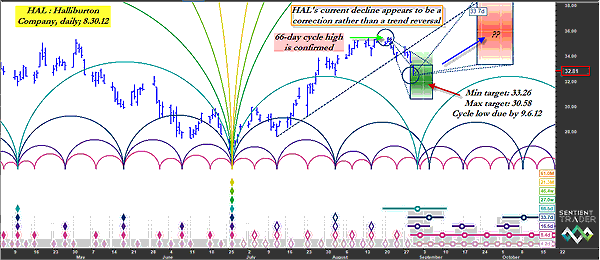
| Running the daily exploration on all 100 .OEX component stocks enabled me to locate a variety of stocks that had experienced a solid 60-day percentage gain even as they had also seen more recent five- and 10-day percentage declines (Figure 1). HAL looked like an interesting stock to perform some additional analysis on, and its daily price cycles analysis chart revealed some very useful information. First off, HAL's break below the 33.7-day valid trendline (VTL) has confirmed that the August 21, 2012, swing high was the nominal 80-day (66.5-day actual length) cycle high; the cycle is expected to bottom (along with several other cycles) sometime between now and September 6, 2012 (the green time/price projection box), somewhere between 30.58 and 33.26 per share and then stage a rally, possibly peaking again in late September-early October 2012 in the price range of 33.35 to 38.72 (see the red time/price projection box). See Figure 2. Having these cycle projections greatly simplifies the task of determining if the initial move lower into the green zone is going to morph into a major trend reversal. At present, this analysis suggests that HAL's recent selloff is a correction against the existing bullish trend rather than the start of a trend reversal. Medium- and long-term money flows are both in bullish territory (not shown), and that also helps solidify the case for a simple, proportional pullback into a tradable multicycle low within the next week or so. Early November 2012 should also see another multicycle low in HAL and many of its brethren in the oil services and equipment industry group, by the way. |

|
| FIGURE 2: HAL, DAILY. Although Halliburton (HAL) has put in a confirmed 66.5-day cycle high, further analysis reveals that the current decline in this energy services stock is probably just a pullback of the existing trend, rather than the start of a trend reversal. |
| Graphic provided by: Sentient Trader. |
| |
| Buying puts here is a risky proposition, since the largest part of the pullback is probably complete, but scale traders might start to build new long positions here in anticipation of HAL's anticipated rally. Skilled put option sellers also have a rational case for selling out-of-the-money (OTM), near-term puts. The September 30.00 puts are going for about $0.17 ($17.00 before commissions and slippage) and are below HAL's green cycle low projection zone. The September 29.00 puts are selling for about $0.11 ($11.00 before commissions and slippage) and offer a bit of extra cushion should HAL decide to drop for a couple more sessions before finally making a swing low. You might want to sell them early in the next trading session if HAL opens lower than Friday's close of 32.76 in hopes of snagging some extra premium, and if you have a large trading account, you might even have the luxury of scaling into your short put position on incremental declines toward the bottom of the green projection zone. If you get the timing reasonably close and HAL rallies as expected, then you can simply buy the puts back if they wither down to only 20% of what you paid for them and then walk away smiling, knowing that the price cycles were (hopefully) your ally and not your enemy. Keep your account risk at no more than 1% to 2% and you'll be even happier in the long run. |
Donald W. Pendergast is a financial markets consultant who offers specialized services to stock brokers and high net worth individuals who seek a better bottom line for their portfolios.
| Title: | Writer, market consultant |
| Company: | Linear Trading Systems LLC |
| Jacksonville, FL 32217 | |
| Phone # for sales: | 904-239-9564 |
| E-mail address: | lineartradingsys@gmail.com |
Traders' Resource Links | |
| Linear Trading Systems LLC has not added any product or service information to TRADERS' RESOURCE. | |
Click here for more information about our publications!
Comments

Request Information From Our Sponsors
- StockCharts.com, Inc.
- Candle Patterns
- Candlestick Charting Explained
- Intermarket Technical Analysis
- John Murphy on Chart Analysis
- John Murphy's Chart Pattern Recognition
- John Murphy's Market Message
- MurphyExplainsMarketAnalysis-Intermarket Analysis
- MurphyExplainsMarketAnalysis-Visual Analysis
- StockCharts.com
- Technical Analysis of the Financial Markets
- The Visual Investor
- VectorVest, Inc.
- Executive Premier Workshop
- One-Day Options Course
- OptionsPro
- Retirement Income Workshop
- Sure-Fire Trading Systems (VectorVest, Inc.)
- Trading as a Business Workshop
- VectorVest 7 EOD
- VectorVest 7 RealTime/IntraDay
- VectorVest AutoTester
- VectorVest Educational Services
- VectorVest OnLine
- VectorVest Options Analyzer
- VectorVest ProGraphics v6.0
- VectorVest ProTrader 7
- VectorVest RealTime Derby Tool
- VectorVest Simulator
- VectorVest Variator
- VectorVest Watchdog
