HOT TOPICS LIST
- MACD
- Fibonacci
- RSI
- Gann
- ADXR
- Stochastics
- Volume
- Triangles
- Futures
- Cycles
- Volatility
- ZIGZAG
- MESA
- Retracement
- Aroon
INDICATORS LIST
LIST OF TOPICS
PRINT THIS ARTICLE
by Donald W. Pendergast, Jr.
The .OEX broke below the support level of its recent trading range on Thursday; expect the September decline to get going soon.
Position: N/A
Donald W. Pendergast, Jr.
Donald W. Pendergast is a financial markets consultant who offers specialized services to stock brokers and high net worth individuals who seek a better bottom line for their portfolios.
PRINT THIS ARTICLE
TECHNICAL ANALYSIS
PENDY'S PICKS: August 31, 2012
08/31/12 09:44:54 AMby Donald W. Pendergast, Jr.
The .OEX broke below the support level of its recent trading range on Thursday; expect the September decline to get going soon.
Position: N/A
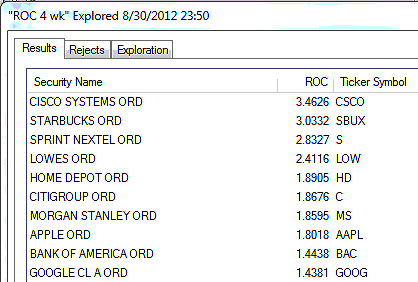
| Figure 1 shows us the strongest four-week relative strength (RS) performers in the .OEX. Citigroup (C) has enjoyed a nice rally since putting in a double bottom earlier this summer, but long-term money flows remain anemic; a pullback in September is very likely. Morgan Stanley's (MS) chart pattern shares many of the same characteristics; the stock looks like it wants to gain even more ground, but its long-term money flows just aren't confirming that possibility anytime soon. One of Pendy's Picks stock trading systems will actually trigger a buy in MS on a rise above 14.96, however; the target price is 15.35 to 15.40 if the trade follows through with an entry trigger. SprintNextel (S) is resting comfortably above its 21-day exponential moving average (EMA); money flows are still bullish, but cycle analysis suggests that the stock is due for a multicycle low in the weeks ahead, as are most of the stocks within the S&P 100 and S&P 500. |

|
| FIGURE 1: STRONGEST COMPONENTS. The 10 strongest S&P 100 (.OEX) components over the past month, as of Thursday, August 30, 2012. |
| Graphic provided by: MetaStock. |
| Graphic provided by: MetaStock Explorer. |
| |
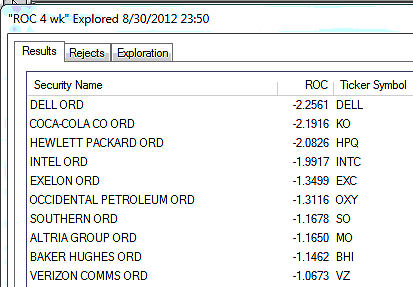
| Figure 2 is a look at the weakest four-week RS performers in the .OEX; Baker Hughes (BHI) is a recent addition to this list and has successfully tested gap support near 44.18 so there could be a bit of a bounce in the next few sessions before its correction continues. Verizon Communications (VZ), although weak in August, has made a leisurely, proportional retracement of its April through July 2012 rally; long-term money flows remain excellent. Coca-Cola (KO) took a hit this week, confirming a multicycle high as it declined. Although the stock has already hit a short-term profit target (for short sellers, that is), there may be more downside to come as the .OEX sets up for its next decline. |

|
| FIGURE 2: WEAKEST COMPONENTS. The 10 weakest S&P 100 (.OEX) components over the past month, as of Thursday, August 30, 2012. |
| Graphic provided by: MetaStock. |
| Graphic provided by: MetaStock Explorer. |
| |
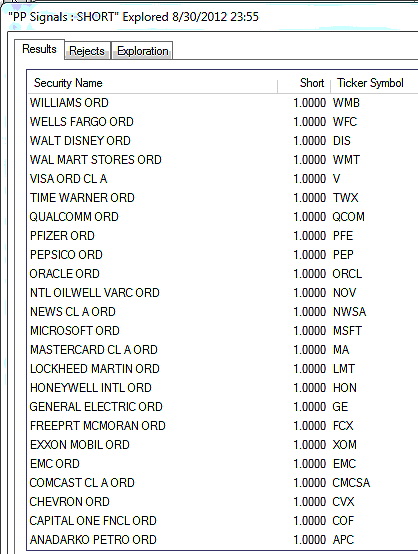
| Figure 3 are the S&P 100 components giving sell setup signals; 25% of the .OEX components issued new sell setup signals on Thursday, and there were no new buy setup signals at all. Among the sell signals, Qualcomm (QCOM) is looking like it's ready to move even lower; money flows are mixed and a decline below 61.06 triggers a short entry. Lockheed Martin (LMT) made a multicycle high on August 21, 2012, and appears to have more downside to come in the weeks ahead; a new short entry will be triggered on a decline beneath 90.52. Look for major support near the 87.00 area to hold in the near term. Freeport-McMoran (FCX) triggers a new short entry if 34.65 is taken out soon. The stock has bearish long-term cycles in play now that should take this large-cap miner into the sub-$20.00 range by spring 2013. |

|
| FIGURE 3: SELL SETUP SIGNALS. The S&P 100 (.OEX) components issuing sell setup signals at the close of trading on Thursday, August 30, 2012; 25% of all .OEX components fired sell setup signals during the session, with no new buy setup signals issued. |
| Graphic provided by: MetaStock. |
| Graphic provided by: MetaStock Explorer. |
| |
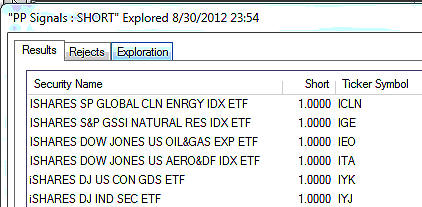
| Among the exchange traded funds (ETFs) that Pendy's Picks follows, there were six sell setup signals (Figure 4). The iShares Defense and Aerospace (ITA) ETF is looking rather ripe for further declines; LMT is certainly a component within ITA, so be on the lookout for weakness in stocks like General Dynamics (GD) and Boeing (BA) as well. ITA goes short on a decline below 63.99. The iShares Oil and Gas Exploration (IEZ) ETF is also on the move -- lower; it will trigger a new short entry on a drop below 60.85. Big stocks in this ETF include Chevron (CVX), ExxonMobil (XOM), and ConocoPhillips (COP), and these are certainly worth monitoring for further declines, too. |

|
| FIGURE 4: NEW SELL SETUP SIGNALS. The exchange traded funds that issued new sell setup signals on Thursday, August 30, 2012; there were no new swing buy signals issued. |
| Graphic provided by: MetaStock. |
| Graphic provided by: MetaStock Explorer. |
| |
| The .OEX lurched lower again on Thursday, once again confirming that the recent swing high of 656.10 is likely the major high for 2012. Despite some fakeouts to the upside, expect the major US stock indexes to decline throughout September 2012. The next issue of Pendy's Picks will include an updated .OEX cycles chart that may better help you understand what the next two- to six-month time period may hold in store for the .OEX. Trade wisely until we meet here again. |
Donald W. Pendergast is a financial markets consultant who offers specialized services to stock brokers and high net worth individuals who seek a better bottom line for their portfolios.
| Title: | Writer, market consultant |
| Company: | Linear Trading Systems LLC |
| Jacksonville, FL 32217 | |
| Phone # for sales: | 904-239-9564 |
| E-mail address: | lineartradingsys@gmail.com |
Traders' Resource Links | |
| Linear Trading Systems LLC has not added any product or service information to TRADERS' RESOURCE. | |
Click here for more information about our publications!
PRINT THIS ARTICLE

Request Information From Our Sponsors
- StockCharts.com, Inc.
- Candle Patterns
- Candlestick Charting Explained
- Intermarket Technical Analysis
- John Murphy on Chart Analysis
- John Murphy's Chart Pattern Recognition
- John Murphy's Market Message
- MurphyExplainsMarketAnalysis-Intermarket Analysis
- MurphyExplainsMarketAnalysis-Visual Analysis
- StockCharts.com
- Technical Analysis of the Financial Markets
- The Visual Investor
- VectorVest, Inc.
- Executive Premier Workshop
- One-Day Options Course
- OptionsPro
- Retirement Income Workshop
- Sure-Fire Trading Systems (VectorVest, Inc.)
- Trading as a Business Workshop
- VectorVest 7 EOD
- VectorVest 7 RealTime/IntraDay
- VectorVest AutoTester
- VectorVest Educational Services
- VectorVest OnLine
- VectorVest Options Analyzer
- VectorVest ProGraphics v6.0
- VectorVest ProTrader 7
- VectorVest RealTime Derby Tool
- VectorVest Simulator
- VectorVest Variator
- VectorVest Watchdog
