HOT TOPICS LIST
- MACD
- Fibonacci
- RSI
- Gann
- ADXR
- Stochastics
- Volume
- Triangles
- Futures
- Cycles
- Volatility
- ZIGZAG
- MESA
- Retracement
- Aroon
INDICATORS LIST
LIST OF TOPICS
PRINT THIS ARTICLE
by Matt Blackman
"Trader Vic" Sperandeo wrote about a pattern that he said had been a big money maker for him over the years. It recently appeared on a number of indexes. What does it mean?
Position: Sell
Matt Blackman
Matt Blackman is a full-time technical and financial writer and trader. He produces corporate and financial newsletters, and assists clients in getting published in the mainstream media. He is the host of TradeSystemGuru.com. Matt has earned the Chartered Market Technician (CMT) designation. Find out what stocks and futures Matt is watching on Twitter at www.twitter.com/RatioTrade
PRINT THIS ARTICLE
DIVERGENCE INDEX
The Recent Potential 2B Top And What It Means For Stocks
08/31/12 09:21:57 AMby Matt Blackman
"Trader Vic" Sperandeo wrote about a pattern that he said had been a big money maker for him over the years. It recently appeared on a number of indexes. What does it mean?
Position: Sell
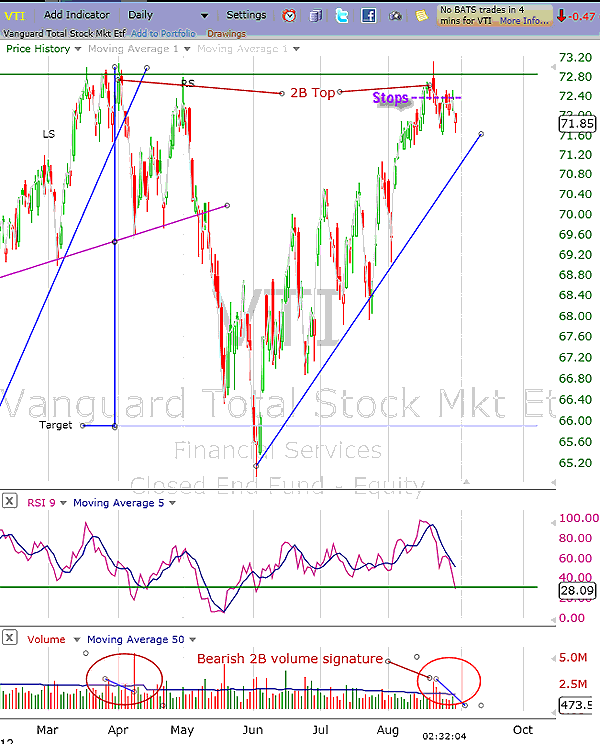
| In 1993, "Methods Of A Wall Street Master" by Victor "Trader Vic" Sperandeo was published. In it, he discussed a pattern he called the "2B top." In a correction, the pattern is reversed and signals a bullish reversal in a move known as a "2B bottom." Here we see the potential 2B top that occurred recently on the broad-based Vanguard Total Stock Market exchange traded fund (ETF)(VTI). |

|
| FIGURE 1: VTI, DAILY. Here's a chart showing the potential 2B top on the Vanguard Total Market ETF (VTI) in late August. |
| Graphic provided by: FreeStockCharts.com. |
| |
| In a nutshell, a 2B top is said to occur when a stock or future puts in a new high not long after a previous high has occurred. However, the new high occurs on lighter volume, which reveals diminished buying interest. |

|
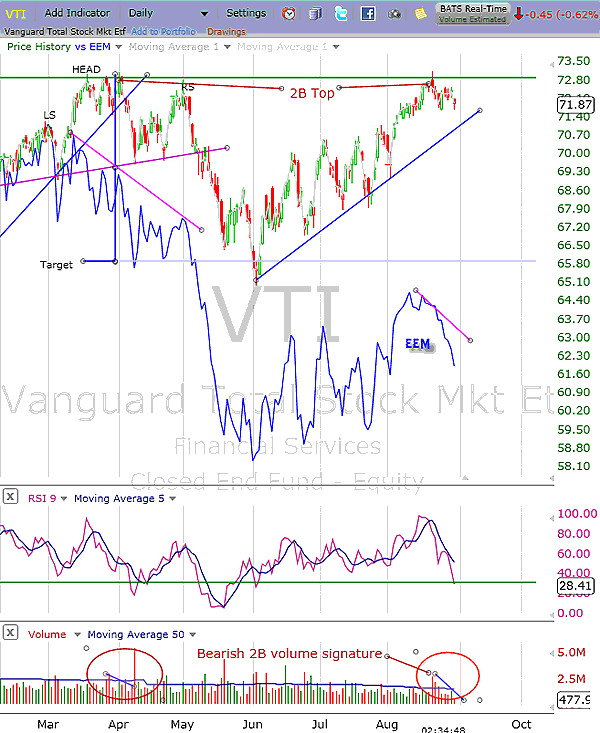
| FIGURE 2: VTI, EEM. Here's a chart of VTI together with the iShares MSCI Emerging Market ETF (EEM) showing strong negative divergence. |
| Graphic provided by: FreeStockCharts.com. |
| |
| It can be such a strong short signal (in a rally) or long signal in a correction (2B bottom) because of the placement of stops by floor and retail traders at key support below the higher high (and slightly below the first high). If the breakout fails and the price then drops, the break of this key support level triggers a flurry of sell orders, causing selling volume to accelerate, which in turn triggers an accelerated price decline (see Figure 1). In the case of the VTI, selling initially accelerated, but then a new wave of buying temporarily pushed price back above the stop price support before selling resumed. However, given the lack of commitment from buyers, as evidenced by the volume drop and collapse in the relative strength index (RSI)(middle chart window), the probability of a recovery and continued rally must be considered slim at this point. |
| As we see in Figure 2, the iShares MSCI Emerging Market ETF (EEM), which has led North American indexes, also supports a continued correction from here. Note how the EEM negatively diverged with VTI in April and May 2012 and how the VTI followed suit not long after. As this chart shows, EEM experienced a big drop after its mid-August high, but unlike US stock indexes, emerging markets put in a lower high -- another indication of bearish negative divergence. As Sperandeo says in his book, "It is essential that you admit defeat quickly if the trade moves against you. As long as you take only small losses ... the probabilities of success using the 2B in the intermediate terms are much higher." |
| Sperandeo offered another important caveat to those looking to trade the pattern. "The 2B and how it occurs presupposes market activity in the absence of major news or new developments in any particular security or market. To trade on the 2B observation alone without particularized knowledge can be very risky, especially in commodities markets, which are so news-sensitive. But when used in the widest possible context of knowledge available, this observation can make the speculator a lot of money." Certainly, markets of late fit the first requirement -- absence of major news or new developments -- a situation that could rapidly change if Bernanke hints at more quantitative easing in the next few weeks. |
Matt Blackman is a full-time technical and financial writer and trader. He produces corporate and financial newsletters, and assists clients in getting published in the mainstream media. He is the host of TradeSystemGuru.com. Matt has earned the Chartered Market Technician (CMT) designation. Find out what stocks and futures Matt is watching on Twitter at www.twitter.com/RatioTrade
| Company: | TradeSystemGuru.com |
| Address: | Box 2589 |
| Garibaldi Highlands, BC Canada | |
| Phone # for sales: | 604-898-9069 |
| Fax: | 604-898-9069 |
| Website: | www.tradesystemguru.com |
| E-mail address: | indextradermb@gmail.com |
Traders' Resource Links | |
| TradeSystemGuru.com has not added any product or service information to TRADERS' RESOURCE. | |
Click here for more information about our publications!
PRINT THIS ARTICLE

Request Information From Our Sponsors
- StockCharts.com, Inc.
- Candle Patterns
- Candlestick Charting Explained
- Intermarket Technical Analysis
- John Murphy on Chart Analysis
- John Murphy's Chart Pattern Recognition
- John Murphy's Market Message
- MurphyExplainsMarketAnalysis-Intermarket Analysis
- MurphyExplainsMarketAnalysis-Visual Analysis
- StockCharts.com
- Technical Analysis of the Financial Markets
- The Visual Investor
- VectorVest, Inc.
- Executive Premier Workshop
- One-Day Options Course
- OptionsPro
- Retirement Income Workshop
- Sure-Fire Trading Systems (VectorVest, Inc.)
- Trading as a Business Workshop
- VectorVest 7 EOD
- VectorVest 7 RealTime/IntraDay
- VectorVest AutoTester
- VectorVest Educational Services
- VectorVest OnLine
- VectorVest Options Analyzer
- VectorVest ProGraphics v6.0
- VectorVest ProTrader 7
- VectorVest RealTime Derby Tool
- VectorVest Simulator
- VectorVest Variator
- VectorVest Watchdog
