

HOT TOPICS LIST
- MACD
- Fibonacci
- RSI
- Gann
- ADXR
- Stochastics
- Volume
- Triangles
- Futures
- Cycles
- Volatility
- ZIGZAG
- MESA
- Retracement
- Aroon
INDICATORS LIST
LIST OF TOPICS
PRINT THIS ARTICLE
by Donald W. Pendergast, Jr.
No matter which time frame you enjoy trading in, it's always a good idea to look at the big picture to see which stocks are making significant pullbacks and/or trend reversals.
Position: N/A
Donald W. Pendergast, Jr.
Donald W. Pendergast is a financial markets consultant who offers specialized services to stock brokers and high net worth individuals who seek a better bottom line for their portfolios.
PRINT THIS ARTICLE
REVERSAL
Scanning For Reversal Setups
09/04/12 09:18:21 AMby Donald W. Pendergast, Jr.
No matter which time frame you enjoy trading in, it's always a good idea to look at the big picture to see which stocks are making significant pullbacks and/or trend reversals.
Position: N/A
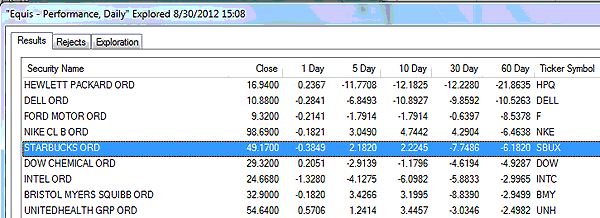
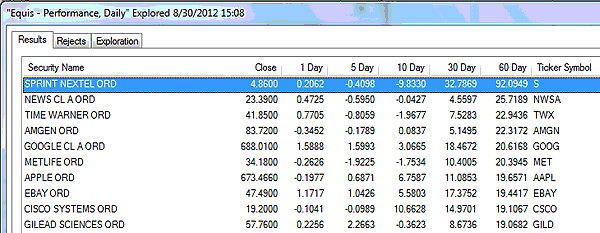
| If you enjoy sifting through potentially useful market statistics, then the "Equis: Performance, Daily" exploration from MetaStock 11 can be a valuable ally as you screen for stocks manifesting these characteristics: 1. Stocks with a negative 60-day performance (percentage gain or decline) that have begun to turn higher in the past five- and 10-day periods -- a possible bullish trend reversal candidate. 2. Stocks that have done extremely well over the past 60 days that are moving lower over the past five- and 10-day periods -- a potential sign of a bearish trend reversal or pullback candidate. 3. Stocks that are weak over the past 60-day period, strong over the past 30 days and are also weak over the past five days; this can help identify stocks about to enter a trading range or those that are in even longer term downtrends. There are unlimited ways to use this exploration's output, so let's look at a few chart patterns based on two of the concepts listed here. |
|
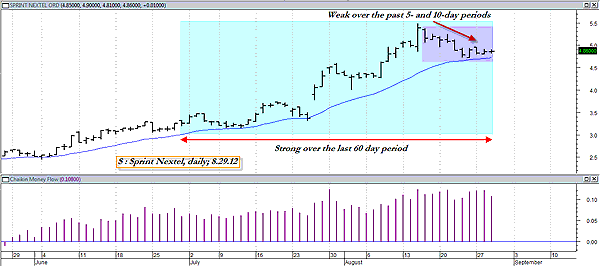
| FIGURE 1: S, DAILY. Analyzing the percentage gain/loss of a stock across different time periods can help you to identify various kinds of pullback and/or trend reversal setups that are under way in your favorite stocks. |
| Graphic provided by: MetaStock. |
| |
| Glancing at the daily chart for SprintNextel (S) (Figure 1), we find that this is a very good example of the kind of stock that exploration #2 would be able to help you locate; S has made a proportional pullback to support, possibly forming a tradable cycle low in the process. The use of a reliable mechanical swing trading system could be of great value in such a chart setup, as it would be better able to time a potential entry than most discretionary traders could; in addition, you could also check other technicals like money flow, sector rotation, volatility, overbought/oversold oscillators, and so on, once you've found the stocks meeting the criteria you specify. |
|
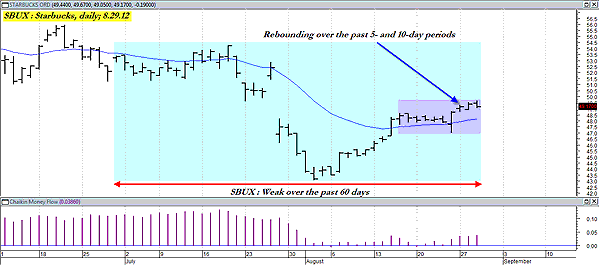
| FIGURE 2: SBUX, DAILY. Although SBUX has been relatively weak over the past two months, its performance over the last four weeks has been strong; a possible continuation move may be setting up here on its daily chart. |
| Graphic provided by: MetaStock. |
| |
| The next example is found on a daily chart of Starbucks (SBUX) (Figure 2); the stock has been weak over the past two months (shaded blue zone) but has been rising for the past five and 10 days (purple zone) as well as for most of August. This would be an example of exploration #1 mentioned earlier and a very easy way to identify stocks on the rebound. Again, you wouldn't want to base your trading decisions solely on these exploration outputs, but they can be a great foundation upon which to do a more thorough analysis. See Figures 3 and 4. One nice thing about explorations #1 and #2 is that they can help make the trading of trend reversals very straightforward and less stressful. For example, although a few traders might be highly skilled at calling major reversals on daily charts, most are not, and they are much better served by looking for stocks identified by explorations #1 and #2 as the stocks will already have made some sort of a cycle low or high and will also be in process of pulling back and/or initiating a trend reversal. From there, it's just a matter of relying on more research and analysis along with the output of a proven mechanical trading system to help get traders into and out of their chosen reversal stocks. If you haven't used this type of an exploration or screening process before, you owe it to yourself to give it a go -- the rewards could be very worthwhile and your trading process may become more streamlined to boot. |
|
| FIGURE 3: WORST COMPONENTS. .OEX component stocks ranked according to their 60-day price gain/loss, with the worst performers listed on top. |
| Graphic provided by: MetaStock. |
| Graphic provided by: MetaStock Explorer. |
| |
|
| FIGURE 4: BEST COMPONENTS. .OEX component stocks ranked according to their 60-day price gain/loss, with the best performers listed on top. |
| Graphic provided by: MetaStock. |
| Graphic provided by: MetaStock Explorer. |
| |
Donald W. Pendergast is a financial markets consultant who offers specialized services to stock brokers and high net worth individuals who seek a better bottom line for their portfolios.
| Title: | Writer, market consultant |
| Company: | Linear Trading Systems LLC |
| Jacksonville, FL 32217 | |
| Phone # for sales: | 904-239-9564 |
| E-mail address: | lineartradingsys@gmail.com |
Traders' Resource Links | |
| Linear Trading Systems LLC has not added any product or service information to TRADERS' RESOURCE. | |
Click here for more information about our publications!
Comments
Date:�09/06/12Rank:�3Comment:�

Request Information From Our Sponsors
- VectorVest, Inc.
- Executive Premier Workshop
- One-Day Options Course
- OptionsPro
- Retirement Income Workshop
- Sure-Fire Trading Systems (VectorVest, Inc.)
- Trading as a Business Workshop
- VectorVest 7 EOD
- VectorVest 7 RealTime/IntraDay
- VectorVest AutoTester
- VectorVest Educational Services
- VectorVest OnLine
- VectorVest Options Analyzer
- VectorVest ProGraphics v6.0
- VectorVest ProTrader 7
- VectorVest RealTime Derby Tool
- VectorVest Simulator
- VectorVest Variator
- VectorVest Watchdog
- StockCharts.com, Inc.
- Candle Patterns
- Candlestick Charting Explained
- Intermarket Technical Analysis
- John Murphy on Chart Analysis
- John Murphy's Chart Pattern Recognition
- John Murphy's Market Message
- MurphyExplainsMarketAnalysis-Intermarket Analysis
- MurphyExplainsMarketAnalysis-Visual Analysis
- StockCharts.com
- Technical Analysis of the Financial Markets
- The Visual Investor