HOT TOPICS LIST
- MACD
- Fibonacci
- RSI
- Gann
- ADXR
- Stochastics
- Volume
- Triangles
- Futures
- Cycles
- Volatility
- ZIGZAG
- MESA
- Retracement
- Aroon
INDICATORS LIST
LIST OF TOPICS
PRINT THIS ARTICLE
by Gary Grosschadl
The chart of this software company may be coming to a crucial stage.
Position: N/A
Gary Grosschadl
Independent Canadian equities trader and technical analyst based in Peterborough
Ontario, Canada.
PRINT THIS ARTICLE
CHART ANALYSIS
Flags and Bakbone Software
07/15/02 12:16:03 PMby Gary Grosschadl
The chart of this software company may be coming to a crucial stage.
Position: N/A
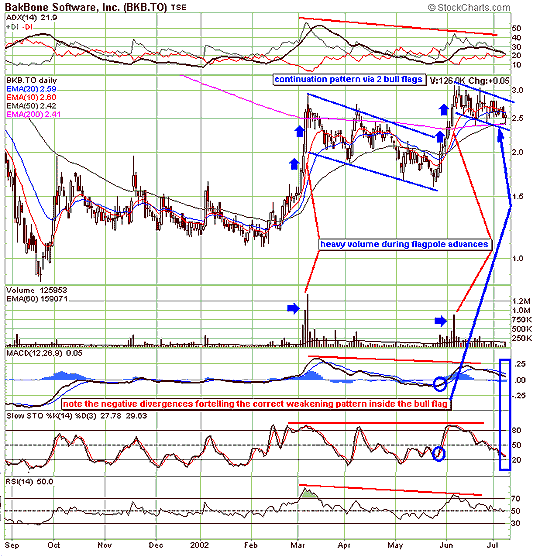
| Bakbone Software has had a somewhat labored climb from its low of $1 last year. It was caught in a 5-month trendless trading range until it formed a continuation pattern consisting of the first of two bull flags. A flag is a small rectangle pattern that slopes against the previous trend. If the previous move was up, then the flag would slope down. If the move was down, then the flag would slope up. In this case it is a bullish continuation pattern. Ideally they last one to four weeks but can go as long as 12 weeks as seen in this first flag. |
| Flag patterns are characterized by "flag poles" that take the form of heavy volume advances from the previous resistance area to the high of the subsequent flag. The length of the flagpole can be used to roughly measure the next rise. |

|
| |
| Using the displayed indicators - ADX, MACD, stochastics and RSI, the alert trader had evidence of the peak forming in the next potential flag formation. |
| The stock appears to be at or very near a crucial point. The stock has good support from its important 200-day EMA and this could be an ideal launchpad for the next advance. Preferably another heavy volume advance as in the past, possibly setting up another continuation pattern. On the other hand, a move below this 200-day EMA would be potentially very bearish as a trend change. A bullish tipoff, besides increased volume, could happen as before in the form of MACD and stochastic crosses (see circled areas). These would be early signals before the really big volume kicks in. |
| The fact that this tech company has held up this well during the current mahem by staying above its 200-day EMA could bode well in the near future. But a move below 2.40 negates the bullish view, while strength above this line combined with bullish crosses for MACD and stochastics, paves the way for more upside. |
Independent Canadian equities trader and technical analyst based in Peterborough
Ontario, Canada.
| Website: | www.whatsonsale.ca/financial.html |
| E-mail address: | gwg7@sympatico.ca |
Click here for more information about our publications!
Comments
Date: 07/16/02Rank: 5Comment:
Date: 07/17/02Rank: 4Comment:

Request Information From Our Sponsors
- StockCharts.com, Inc.
- Candle Patterns
- Candlestick Charting Explained
- Intermarket Technical Analysis
- John Murphy on Chart Analysis
- John Murphy's Chart Pattern Recognition
- John Murphy's Market Message
- MurphyExplainsMarketAnalysis-Intermarket Analysis
- MurphyExplainsMarketAnalysis-Visual Analysis
- StockCharts.com
- Technical Analysis of the Financial Markets
- The Visual Investor
- VectorVest, Inc.
- Executive Premier Workshop
- One-Day Options Course
- OptionsPro
- Retirement Income Workshop
- Sure-Fire Trading Systems (VectorVest, Inc.)
- Trading as a Business Workshop
- VectorVest 7 EOD
- VectorVest 7 RealTime/IntraDay
- VectorVest AutoTester
- VectorVest Educational Services
- VectorVest OnLine
- VectorVest Options Analyzer
- VectorVest ProGraphics v6.0
- VectorVest ProTrader 7
- VectorVest RealTime Derby Tool
- VectorVest Simulator
- VectorVest Variator
- VectorVest Watchdog
