HOT TOPICS LIST
- MACD
- Fibonacci
- RSI
- Gann
- ADXR
- Stochastics
- Volume
- Triangles
- Futures
- Cycles
- Volatility
- ZIGZAG
- MESA
- Retracement
- Aroon
INDICATORS LIST
LIST OF TOPICS
PRINT THIS ARTICLE
by Koos van der Merwe
Do you want to invest in China? Here is a company worth looking at.
Position: Buy
Koos van der Merwe
Has been a technical analyst since 1969, and has worked as a futures and options trader with First Financial Futures in Johannesburg, South Africa.
PRINT THIS ARTICLE
TRIANGLES
Say Baidu Of China
08/30/12 08:47:17 AMby Koos van der Merwe
Do you want to invest in China? Here is a company worth looking at.
Position: Buy
| Founded in 2000, Baidu is a Chinese language search platform that dominated the Chinese online ad market in 2007. Over 150,000 small and midsized Chinese enterprises, large domestic corporations, and Chinese divisions or subsidiaries of large multinational corporations have benefited from Baidu's online search marketing services. The company listed itself on the NASDAQ market in August 2005, and the price has risen from a low of $4.50 in February 2006 to its present price of $115.52. With China starting to experience a lack of confidence for investors, is Baidu worth a buy? |

|
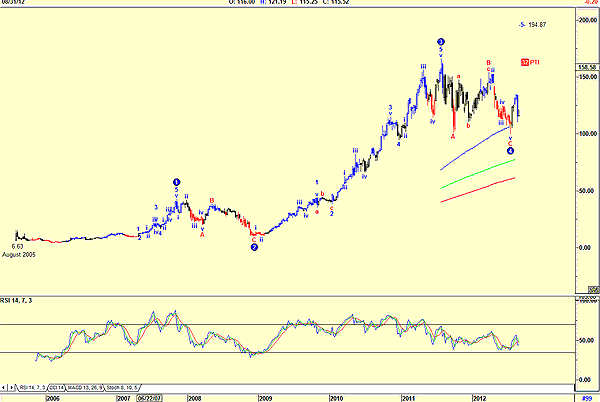
| FIGURE 1: BAIDU, MONTHLY. Here's a monthly chart showing an Elliott wave count. |
| Graphic provided by: AdvancedGET. |
| |
| Figure 1 is a weekly chart showing an Elliott wave count of Baidu from its listing date in August 2005. The count is suggesting that the price has completed a wave 4 correction and is now in a wave 5 move up with a target of $194.87. The probability index (PTI) is suggesting a 32% probability that this will occur; 32% is the lowest limit acceptable by the index, in that anything below this level casts doubt on the Elliott wave forecast. This is emphasized by the relative strength index (RSI), which is still trending down and has not given a buy signal. Do we buy or do we wait? To answer that, we look at a daily chart. |

|
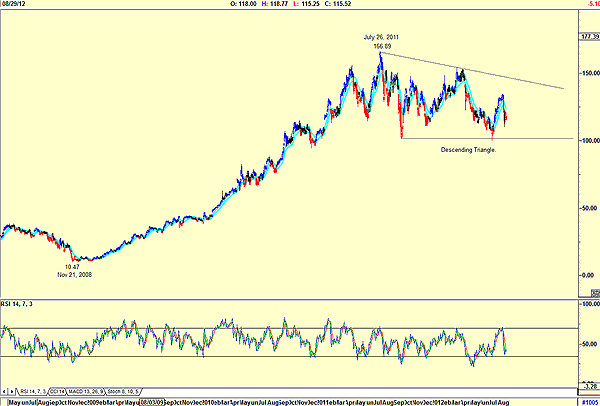
| FIGURE 2: BAIDU, DAILY. Here's a daily chart showing a descending triangle. |
| Graphic provided by: AdvancedGET. |
| |
| The daily chart shown in Figure 2 is suggesting the formation of a descending triangle. This is a triangle with a horizontal lower boundary and a downsloping upper boundary. This formation occurs when there is a certain amount of demand at a fixed price, yet supply continues to come into the market. Eventually, demand is exhausted and the price breaks out of the triangle to the downside. So what led me to look at this share as a possible buy? |

|
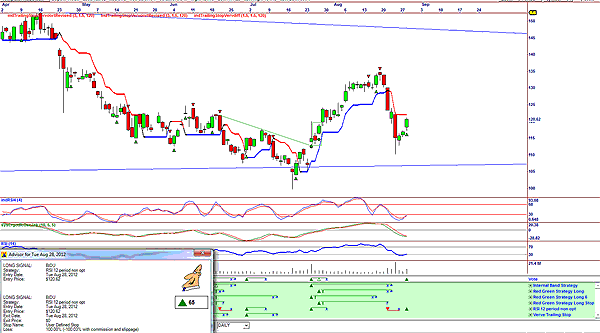
| FIGURE 3: BAIDU, DAILY. Here's a daily chart suggesting a short-term buy signal. |
| Graphic provided by: OmniTrader. |
| |
| Figure 3 is an OmniTrader daily chart that gave me a buy signal. The vote line has signaled a buy based on the RSI 12-period strategy. The advisor rating shown on the chart is 65, which is a solid number. The entry price suggested is $120.62 on August 28. I would be a buyer of Baidu based purely on the OmniTrader buy signal, but I would keep my stops very close. |
Has been a technical analyst since 1969, and has worked as a futures and options trader with First Financial Futures in Johannesburg, South Africa.
| Address: | 3256 West 24th Ave |
| Vancouver, BC | |
| Phone # for sales: | 6042634214 |
| E-mail address: | petroosp@gmail.com |
Click here for more information about our publications!
Comments

Request Information From Our Sponsors
- VectorVest, Inc.
- Executive Premier Workshop
- One-Day Options Course
- OptionsPro
- Retirement Income Workshop
- Sure-Fire Trading Systems (VectorVest, Inc.)
- Trading as a Business Workshop
- VectorVest 7 EOD
- VectorVest 7 RealTime/IntraDay
- VectorVest AutoTester
- VectorVest Educational Services
- VectorVest OnLine
- VectorVest Options Analyzer
- VectorVest ProGraphics v6.0
- VectorVest ProTrader 7
- VectorVest RealTime Derby Tool
- VectorVest Simulator
- VectorVest Variator
- VectorVest Watchdog
- StockCharts.com, Inc.
- Candle Patterns
- Candlestick Charting Explained
- Intermarket Technical Analysis
- John Murphy on Chart Analysis
- John Murphy's Chart Pattern Recognition
- John Murphy's Market Message
- MurphyExplainsMarketAnalysis-Intermarket Analysis
- MurphyExplainsMarketAnalysis-Visual Analysis
- StockCharts.com
- Technical Analysis of the Financial Markets
- The Visual Investor
