HOT TOPICS LIST
- MACD
- Fibonacci
- RSI
- Gann
- ADXR
- Stochastics
- Volume
- Triangles
- Futures
- Cycles
- Volatility
- ZIGZAG
- MESA
- Retracement
- Aroon
INDICATORS LIST
LIST OF TOPICS
PRINT THIS ARTICLE
by Donald W. Pendergast, Jr.
Shares of Pepsico have enjoyed a modestly bullish, long-term rally since March 2009, but technicals warn of an impending correction.
Position: N/A
Donald W. Pendergast, Jr.
Donald W. Pendergast is a financial markets consultant who offers specialized services to stock brokers and high net worth individuals who seek a better bottom line for their portfolios.
PRINT THIS ARTICLE
NEW HIGHS-NEW LOWS
Pepsico Ready To Fizz Out?
08/30/12 08:30:09 AMby Donald W. Pendergast, Jr.
Shares of Pepsico have enjoyed a modestly bullish, long-term rally since March 2009, but technicals warn of an impending correction.
Position: N/A
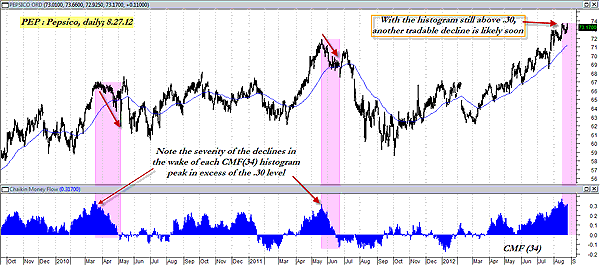
| Large-cap stocks aren't always the most exciting financial instruments to trade or invest in, but many of them can be suitable covered-call writing candidates when the broad market indexes are in a steady uptrend. Pepsico (PEP) enjoyed several bullish trending phases over the last three and a half years but is now flashing a powerful warning signal that a correction and/or trend reversal is near. Here's a closer look (Figures 1 and 2). |

|
| FIGURE 1: PEP, DAILY. When money flow histograms reach certain extremes (in either direction), trend reversals and/or corrections of the existing trend usually occur shortly thereafter. |
| Graphic provided by: MetaStock. |
| Graphic provided by: Deel New Highs screen from MetaStock 11. |
| |
| Money flow analysis may not always help you pinpoint precise entry/exit zones as you trade your favorite stocks or exchange traded funds (ETFs), but they can certainly alert you to approaching high-probability trend reversal situations in almost any liquid stock that has good trending capability. Look at the following examples from PEP's daily chart (Figure 1). The blue histogram at the bottom is based on the 34-day Chaikin money flow indicator, and when it makes extreme peaks and troughs, there is usually a significant reversal in the trend of this stock. For example, on March 17, 2010, PEP reached 66.58 as the histogram peaked above 0.30 and soon began a corrective move of about 11% over the next three months. This histogram peaked above 0.30 again on May 19, 2012, with PEP trading at 71.89. Over the next four and a half months, PEP declined to 58.50. The same 34-day Chaikin money flow histogram most recently exceeded 0.30 on August 16, 2012, with PEP trading at 73.61; the stock is still trading at about the same price level, but as of August 27, 2012, the histogram had declined to just above the 0.30 level, complete with a bearish price/money flow divergence evident on its daily chart. Also note that PEP has been trending steadily higher above its 21-day exponential moving average (EMA) for nearly six months now. Most bullish runs in PEP don't manage to stay above this key EMA for much more than six months, and given the other two technicals mentioned, anyone currently holding long positions in PEP needs to start thinking about running a closer trailing stop and/or planning a scale out or liquidation strategy in the very near future. |

|
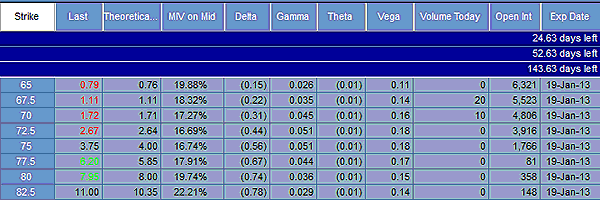
| FIGURE 2: PEP PUTS. A portion of the available January 2013 put options for Pepsico (PEP). Note the heavy open interest at the $65.00 strike. |
| Graphic provided by: TradeStation. |
| |
| Buying put options as a purely speculative profit-seeking play is one way to prepare for the anticipated decline in PEP. Buying an in-the-money (ITM) put such as the January '13 $75.00 puts might be preferable to buying out-of-the-money (OTM) strikes such as the $72.50 or $70.00 versions, as it will suffer a bit less time decay on a percentage basis (since it already has intrinsic value, unlike the OTM puts, which are made up of time value only). The January '13 75.00 put is selling for about $3.75 ($375 before commissions and slippage) as of now and has a theta (time decay) of only $1 per day. Open interest is at 1,766 contracts; the big idea here is to buy the put(s) in anticipation of a swift, powerful short-term down thrust, one that will pump up the value of the put at a much faster rate than the daily time decay factor of $2 can erode it. Each of the last two peaks featured a subsequent $2 to $3 move south in PEP's price, and that's what you also want to look for in this setup, too. Cycles analysis is also suggesting that PEP is due to make a 40-day cycle trough between now and September 10, 2012, and should bottom out between 67.36 and 71.98. The upper range of that price projection zone is a good, logical price target for a trader to take partial (or even full) profits on such an option position, especially in a long put position that is subject to daily (and ever-increasing rates of it, especially during the final four weeks of the put's lifespan) time decay. |
| The .OEX and .SPX are expected to soon resume their downward trajectory by the end of this trading week, taking the price of PEP down to lower levels as well. Consider buying the PEP January '13 $75.00 puts now to be well-positioned for the high-probability decline that is projected in this stock, risking no more than 1% or 2% of your account value. |
Donald W. Pendergast is a financial markets consultant who offers specialized services to stock brokers and high net worth individuals who seek a better bottom line for their portfolios.
| Title: | Writer, market consultant |
| Company: | Linear Trading Systems LLC |
| Jacksonville, FL 32217 | |
| Phone # for sales: | 904-239-9564 |
| E-mail address: | lineartradingsys@gmail.com |
Traders' Resource Links | |
| Linear Trading Systems LLC has not added any product or service information to TRADERS' RESOURCE. | |
Click here for more information about our publications!
PRINT THIS ARTICLE

Request Information From Our Sponsors
- VectorVest, Inc.
- Executive Premier Workshop
- One-Day Options Course
- OptionsPro
- Retirement Income Workshop
- Sure-Fire Trading Systems (VectorVest, Inc.)
- Trading as a Business Workshop
- VectorVest 7 EOD
- VectorVest 7 RealTime/IntraDay
- VectorVest AutoTester
- VectorVest Educational Services
- VectorVest OnLine
- VectorVest Options Analyzer
- VectorVest ProGraphics v6.0
- VectorVest ProTrader 7
- VectorVest RealTime Derby Tool
- VectorVest Simulator
- VectorVest Variator
- VectorVest Watchdog
- StockCharts.com, Inc.
- Candle Patterns
- Candlestick Charting Explained
- Intermarket Technical Analysis
- John Murphy on Chart Analysis
- John Murphy's Chart Pattern Recognition
- John Murphy's Market Message
- MurphyExplainsMarketAnalysis-Intermarket Analysis
- MurphyExplainsMarketAnalysis-Visual Analysis
- StockCharts.com
- Technical Analysis of the Financial Markets
- The Visual Investor
