HOT TOPICS LIST
- MACD
- Fibonacci
- RSI
- Gann
- ADXR
- Stochastics
- Volume
- Triangles
- Futures
- Cycles
- Volatility
- ZIGZAG
- MESA
- Retracement
- Aroon
INDICATORS LIST
LIST OF TOPICS
PRINT THIS ARTICLE
by Billy Williams
The third-largest generic drug maker just got a shot in the arm that could take it higher -- and the market with it!
Position: Buy
Billy Williams
Billy Williams has been trading the markets for 27 years, specializing in momentum trading with stocks and options.
PRINT THIS ARTICLE
STOCKS
WPI On The Move
08/29/12 10:11:01 AMby Billy Williams
The third-largest generic drug maker just got a shot in the arm that could take it higher -- and the market with it!
Position: Buy
| Watson Pharmaceuticals (WPI) got a shot in the arm when WPI acquisition Endo Health Solutions' numbing medication Lidoderm was given the greenlight by the US regulatory commission. WPI, the third-largest generic drug maker in the market, plans to begin selling the product in September 2013 and reports that it will be able to sell the drug for six months without competition. The news of the drug's approval resulted in an increase of 6% to $83.32, its biggest gain in four months. See Figure 1. |

|
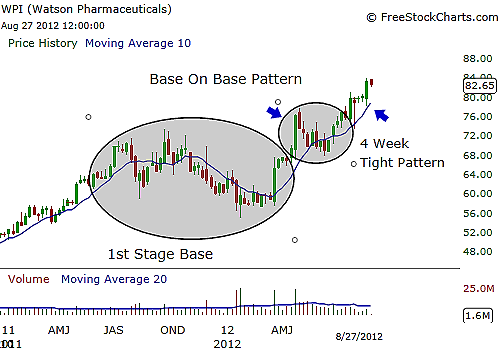
| FIGURE 1: WPI. In the first-stage base pattern, price began to rise on the weekly chart until price stalled and retreated to the 10-week moving average where it found support. Since price did not climb 20% above the previous price high, a base-on-base pattern was formed. A four-week tight pattern soon followed, revealing an long entry setup condition. |
| Graphic provided by: www.freestockcharts.com. |
| |
| In the weeks and months leading up to the breakout in the stock's price, WPI had been developing into a strong candidate for the bulls on both fundamental and technical levels. As a part of the Medical Generic Group in the stock market, WPI has registered a year-to-date return of 18% and is set to outperform the rest of the market if things don't radically change. The last three quarters of earnings have come in at 90%, 84%, and 41%, respectively, followed by sales growth in the last three quarters at 62%, 74%, and 25%, again respectively. Analysts have given annual earnings estimates for 2012 at 22% and 39% for 2013. |

|
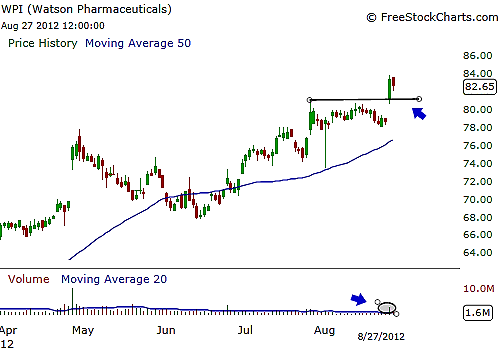
| FIGURE 2: WPI. Coming down to the daily chart, you can see the price high set during the four-week time period where the four-week tight pattern formed. The buy point was 10 cents above the high -- at $83.10 -- and a long entry was signaled on higher volume, on August 24, 2012. |
| Graphic provided by: www.freestockcharts.com. |
| |
| The impressive fundamental data compels "Investor's Business Daily" to score WPI's EPS rating at a 99, but the company's debt-to-equity ratio comes in at 24%, the lone shadow on an otherwise bright balance sheet. Still, this hasn't scared away big investors as institutional buyers and mutual funds can be found, leaving their footprints on the rising accumulation of WPI shares revealed by up/down volume rising for a strong 1.6, on August 17, 2012, to 2.0, where it currently reads. For up/down volume, anything above a 1 shows that the company is being accumulated by the larger investment institutions where price is likely to rise as well. |
| WPI had late 2011 to spring 2012 on the weekly chart, but after a brief gap higher, price began to drift and form a new base-on-base pattern from May 2012 onward. The most telling technical pattern on the weekly chart is the four-week tight pattern formed from late July to mid-August. A four-week tight pattern is formed when weekly price bars close within 1% of each other for four weeks, revealing a contracted price range where a buy point can be established over the highest intraday high set in that four-week range. |
| Dropping down to the daily chart, you can see that the buy point of 10 cents over the highest price during the last four weeks would be a $81.10, which was triggered on August 24, 2012, on higher volume of almost 300% over the last 20-day average. The breakout price bar traded strong throughout the day, rocketing from its opening low to power up higher to close within its upper range established for the day. Due to the price gap, look for price to pull back slightly and consolidate within a few days. Then for a potential second entry you can attempt to go long at $83.93 as the stock gathers steam and attempts to go higher. |
Billy Williams has been trading the markets for 27 years, specializing in momentum trading with stocks and options.
| Company: | StockOptionSystem.com |
| E-mail address: | stockoptionsystem.com@gmail.com |
Traders' Resource Links | |
| StockOptionSystem.com has not added any product or service information to TRADERS' RESOURCE. | |
Click here for more information about our publications!
PRINT THIS ARTICLE

Request Information From Our Sponsors
- StockCharts.com, Inc.
- Candle Patterns
- Candlestick Charting Explained
- Intermarket Technical Analysis
- John Murphy on Chart Analysis
- John Murphy's Chart Pattern Recognition
- John Murphy's Market Message
- MurphyExplainsMarketAnalysis-Intermarket Analysis
- MurphyExplainsMarketAnalysis-Visual Analysis
- StockCharts.com
- Technical Analysis of the Financial Markets
- The Visual Investor
- VectorVest, Inc.
- Executive Premier Workshop
- One-Day Options Course
- OptionsPro
- Retirement Income Workshop
- Sure-Fire Trading Systems (VectorVest, Inc.)
- Trading as a Business Workshop
- VectorVest 7 EOD
- VectorVest 7 RealTime/IntraDay
- VectorVest AutoTester
- VectorVest Educational Services
- VectorVest OnLine
- VectorVest Options Analyzer
- VectorVest ProGraphics v6.0
- VectorVest ProTrader 7
- VectorVest RealTime Derby Tool
- VectorVest Simulator
- VectorVest Variator
- VectorVest Watchdog
