HOT TOPICS LIST
- MACD
- Fibonacci
- RSI
- Gann
- ADXR
- Stochastics
- Volume
- Triangles
- Futures
- Cycles
- Volatility
- ZIGZAG
- MESA
- Retracement
- Aroon
INDICATORS LIST
LIST OF TOPICS
PRINT THIS ARTICLE
by Donald W. Pendergast, Jr.
Friday's trading session saw a minor rebound in the .OEX; look for an attempt to make a new high -- one likely to fall short of that goal.
Position: N/A
Donald W. Pendergast, Jr.
Donald W. Pendergast is a financial markets consultant who offers specialized services to stock brokers and high net worth individuals who seek a better bottom line for their portfolios.
PRINT THIS ARTICLE
TECHNICAL ANALYSIS
PENDY'S PICKS: August 27, 2012
08/27/12 09:47:26 AMby Donald W. Pendergast, Jr.
Friday's trading session saw a minor rebound in the .OEX; look for an attempt to make a new high -- one likely to fall short of that goal.
Position: N/A
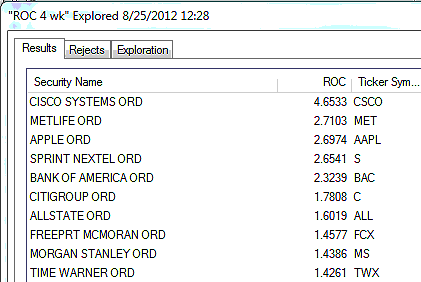
| The .OEX (Standard & Poor's 100) finished Friday's trading session at 649.01, closing up by 0.67%; the index closed near the upper end of its daily range as it attempted to recoup some of last week's losses. Whether this is simply another pullback in the 12-week-old bull rally or is simply a minor rebound before more major declines occur is as yet unknown, but the probabilities highly favor a decline down to significantly lower levels. Figure 1 shows us the strongest four-week relative strength (RS) performers in the .OEX; Cisco Systems (CSCO) is still leading the pack. Sprint Nextel (S) had a minor rebound on Friday but is still expected to correct more substantially; look for the 4.26 region to provide meaningful support as it seeks a multicycle low. Freeport-McMoran (FCX) is still trading below its 200-day exponential moving average (EMA) and is manifesting a bearish price money flow divergence; the stock's 40-day cycle is projected to bottom by early to mid-September 2012 in the $33.00 area, followed by larger-scale declines later in 2012 and into 2013. |

|
| FIGURE 1: STRONGEST COMPONENTS. The 10 strongest S&P 100 (.OEX) components over the past month, as of Wednesday, August 24, 2012. |
| Graphic provided by: MetaStock. |
| Graphic provided by: MetaStock Explorer. |
| |
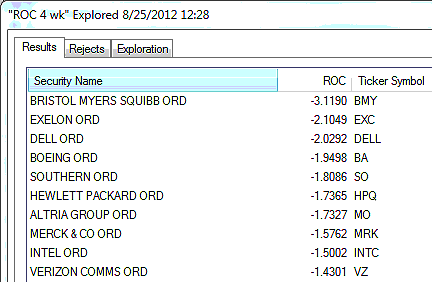
| Figure 2 is a look at the weakest four-week relative strength performers in the .OEX; Hewlett Packard (HPQ) could be attempting to form a double-bottom pattern, or it might just be ready to fall through the floor again. Both its short-term and long-term money flow trends are very anemic. Any drop below 17.41 should be cause for concern, especially for long-term investors in the stock. Altria Group (MO) is in decent technical shape, but it also features bearish money flow trends; expect its 200-day exponential moving average (EMA) (currently near 31.80) to be tested for support sometime during September 2012. Southern Co. (SO), despite being on the weak RS list for a while, actually has positive medium- and long-term money flows and is trading above its 200-day EMA. A daily close above 46.18 actually triggers a long swing trade entry in the stock. |

|
| FIGURE 2: WEAKEST COMPONENTS. The 10 weakest S&P 100 (.OEX) components over the past month, as of Friday, August 24, 2012. |
| Graphic provided by: MetaStock. |
| Graphic provided by: MetaStock Explorer. |
| |
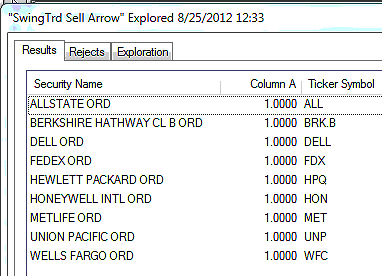
| Figure 3 are the S&P 100 components giving RMO swing sell setup signals; 9% of the .OEX components issued new RMO swing sell signals on Friday. There were also five new swing buy signals. Pendy's Picks firmly believes that the minor rebound seen on Friday will not travel high enough to seriously threaten the recent .OEX high of 656.10. If you consider trading any of these five buy setups (ACN, AXP, BMY, HNZ, PG), be sure to run very close profit targets and trailing stops. As far as the nine sell setups go, MetLife (MET) looks very vulnerable to a decline, as does Wells Fargo (WFC); the latter stock has pronounced negative price/money flow divergences and should have little trouble in soon meeting up with its 32.00 support level. |

|
| FIGURE 3: SWING SELL SIGNALS. The S&P 100 (.OEX) components issuing RMO swing sell signals at the close of trading on Friday, August 24, 2012; 9% of all .OEX components fired swing sell setup signals during the session, with five new swing buy setup signals also issued. |
| Graphic provided by: MetaStock. |
| Graphic provided by: MetaStock Explorer. |
| |
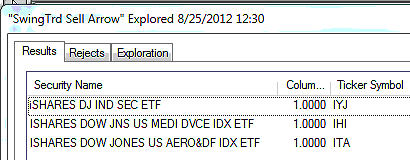
| Among the exchange traded funds (ETFs) that Pendy's Picks follows, there were three sell setup signals to report on Friday -- the iShares Industrial Sector (IYJ), Medical Devices (IHI), and Aerospace and Defense (ITA) ETFs (Figure 4). Sell short trigger points are IJY on a decline 69.57, IHI at 64.62, and ITA at 64.03. |

|
| FIGURE 4: SWING SELL SIGNALS. The exchange traded funds issuing RMO swing sell signals at the close of trading on Friday, August 24, 2012; there were no new swing buy setup signals issued. |
| Graphic provided by: MetaStock. |
| Graphic provided by: MetaStock Explorer. |
| |
| The .OEX rallied on Friday but in the long term, it's the powerful price cycles that drive this key index that are going to ultimately determine its major trend direction -- and that trend direction appears to be down until late September or early October 2012. There may be a few more days of life left in this minor rally, but expect some sort of negative financial (Europe, corporate scandal, fiscal cliff) news trigger to abort the rally, setting up the substantial correction that the cycles are anticipating over the next few months. Trade wisely until we meet here again. |
Donald W. Pendergast is a financial markets consultant who offers specialized services to stock brokers and high net worth individuals who seek a better bottom line for their portfolios.
| Title: | Writer, market consultant |
| Company: | Linear Trading Systems LLC |
| Jacksonville, FL 32217 | |
| Phone # for sales: | 904-239-9564 |
| E-mail address: | lineartradingsys@gmail.com |
Traders' Resource Links | |
| Linear Trading Systems LLC has not added any product or service information to TRADERS' RESOURCE. | |
Click here for more information about our publications!
PRINT THIS ARTICLE

Request Information From Our Sponsors
- StockCharts.com, Inc.
- Candle Patterns
- Candlestick Charting Explained
- Intermarket Technical Analysis
- John Murphy on Chart Analysis
- John Murphy's Chart Pattern Recognition
- John Murphy's Market Message
- MurphyExplainsMarketAnalysis-Intermarket Analysis
- MurphyExplainsMarketAnalysis-Visual Analysis
- StockCharts.com
- Technical Analysis of the Financial Markets
- The Visual Investor
- VectorVest, Inc.
- Executive Premier Workshop
- One-Day Options Course
- OptionsPro
- Retirement Income Workshop
- Sure-Fire Trading Systems (VectorVest, Inc.)
- Trading as a Business Workshop
- VectorVest 7 EOD
- VectorVest 7 RealTime/IntraDay
- VectorVest AutoTester
- VectorVest Educational Services
- VectorVest OnLine
- VectorVest Options Analyzer
- VectorVest ProGraphics v6.0
- VectorVest ProTrader 7
- VectorVest RealTime Derby Tool
- VectorVest Simulator
- VectorVest Variator
- VectorVest Watchdog
