HOT TOPICS LIST
- MACD
- Fibonacci
- RSI
- Gann
- ADXR
- Stochastics
- Volume
- Triangles
- Futures
- Cycles
- Volatility
- ZIGZAG
- MESA
- Retracement
- Aroon
INDICATORS LIST
LIST OF TOPICS
PRINT THIS ARTICLE
by Donald W. Pendergast, Jr.
Shares of Apache Corp. have managed to make a chaotic, yet reasonably steady rise since early June 2012. Is this rally destined to go higher?
Position: N/A
Donald W. Pendergast, Jr.
Donald W. Pendergast is a financial markets consultant who offers specialized services to stock brokers and high net worth individuals who seek a better bottom line for their portfolios.
PRINT THIS ARTICLE
CYCLES
Apache Corp. Topping Soon?
08/29/12 08:37:16 AMby Donald W. Pendergast, Jr.
Shares of Apache Corp. have managed to make a chaotic, yet reasonably steady rise since early June 2012. Is this rally destined to go higher?
Position: N/A
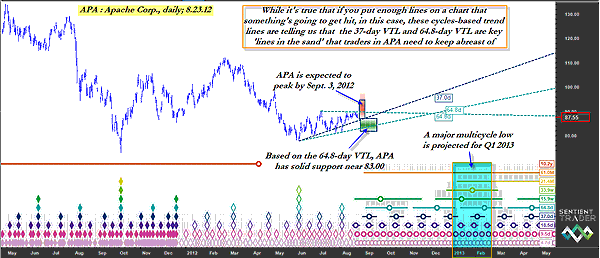
| Despite its recent 11-week-old rally, shares of Apache Corp. (APA) are still in a technical bear market, trading below their 200-day exponential moving average (EMA) and still nearly $50 per share below their April 2011 high of 134.13. Cycles analysis suggests that APA will put in a nominal 40-day cycle high by no later than September 3, 2012, and that a proportional retracement of its June through August 2012 rally will commence shortly thereafter. Here's a closer look at APA now (Figures 1 and 2). |

|
| FIGURE 1: APA, DAILY. APA's recent consolidation has been contained within its 64.8-day VTLs (valid trendlines). The lower VTL appears to coincide with significant support levels expected to be seen on its next cycle low. |
| Graphic provided by: Sentient Trader. |
| |
| APA has experienced a modest bear market rebound since it finally bottomed (after a persistent 13-week decline) on June 4, 2012, managing to rise by as much as 16% before settling into its current trading range. Cycles projection analysis suggests that APA is at a point of indecision; either the stock is soon to descend to a price level of 81.85 to 87.14 between August 27 and September 19, 2012, or it is going to have another minor rally, propelling it up somewhere between 86.99 and 94.74. In this case, the rally would need to happen soon, between August 26 and September 3, 2012. The valid trendlines on the chart (VTLs) show us that the lower 64.8-day VTL should act as powerful support on a near-term decline into the green time/price (TP) projection box, even as the 37-day VTL should act as a tentative support line. Finally, a daily close above the upper 64.8-day VTL would confirm that a rise into the red T/P box is very likely. |

|
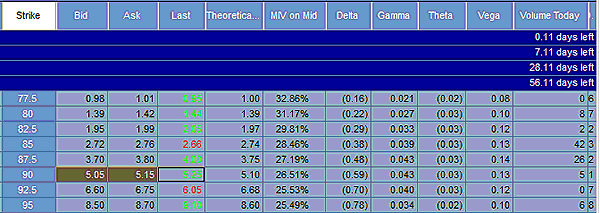
| FIGURE 2: PUT OPTIONS. A variety of October 2012 put options for APA could be used to profit from a possible near-term selloff in the stock. The $90 puts are in-the-money (ITM) and have a decent bid-ask spread. |
| Graphic provided by: TradeStation. |
| |
| Regardless of how the near-term cyclical situation in APA resolves itself, if we look out a few months, we find that a major multicycle low (with as many as six cycles bottoming together) is projected between early January and late February 2013. One technical indicator is modestly bullish on APA at the moment. The 100-period Chaikin money flow (CMF)(100) histogram is above its zero line and is rising; apparently, some of the smart money traders and large institutions still see APA as an attractive place to build a longer-term position. Right now, swing traders should simply monitor APA for breaks above its 64.8-day VTL (above 89.90) and if they see that to expect a rise into the lower to mid-90.00 range. Conversely, they should see if the 86.00 to 86.50 support area holds; a daily close below that level implies that the stock will want to travel down to test the lower VTL support near 83.00. Skilled option traders may be able to use this information to great advantage as long as they use modest position sizing and set-in-stone stop-loss and profit target strategies. The October 2012 $90.00 puts are selling for about $5.15; they have a delta of -0.59, daily time decay of $3 (per contract) and have eight weeks of time value remaining. These could be great short-term tools to use if you see APA break support near 86.00 to 86.50. Using 83.00 to 84.00 as a profit target would also be a great idea should the stock decide to head lower. |
Donald W. Pendergast is a financial markets consultant who offers specialized services to stock brokers and high net worth individuals who seek a better bottom line for their portfolios.
| Title: | Writer, market consultant |
| Company: | Linear Trading Systems LLC |
| Jacksonville, FL 32217 | |
| Phone # for sales: | 904-239-9564 |
| E-mail address: | lineartradingsys@gmail.com |
Traders' Resource Links | |
| Linear Trading Systems LLC has not added any product or service information to TRADERS' RESOURCE. | |
Click here for more information about our publications!
Comments

Request Information From Our Sponsors
- StockCharts.com, Inc.
- Candle Patterns
- Candlestick Charting Explained
- Intermarket Technical Analysis
- John Murphy on Chart Analysis
- John Murphy's Chart Pattern Recognition
- John Murphy's Market Message
- MurphyExplainsMarketAnalysis-Intermarket Analysis
- MurphyExplainsMarketAnalysis-Visual Analysis
- StockCharts.com
- Technical Analysis of the Financial Markets
- The Visual Investor
- VectorVest, Inc.
- Executive Premier Workshop
- One-Day Options Course
- OptionsPro
- Retirement Income Workshop
- Sure-Fire Trading Systems (VectorVest, Inc.)
- Trading as a Business Workshop
- VectorVest 7 EOD
- VectorVest 7 RealTime/IntraDay
- VectorVest AutoTester
- VectorVest Educational Services
- VectorVest OnLine
- VectorVest Options Analyzer
- VectorVest ProGraphics v6.0
- VectorVest ProTrader 7
- VectorVest RealTime Derby Tool
- VectorVest Simulator
- VectorVest Variator
- VectorVest Watchdog
