HOT TOPICS LIST
- MACD
- Fibonacci
- RSI
- Gann
- ADXR
- Stochastics
- Volume
- Triangles
- Futures
- Cycles
- Volatility
- ZIGZAG
- MESA
- Retracement
- Aroon
INDICATORS LIST
LIST OF TOPICS
PRINT THIS ARTICLE
by Donald W. Pendergast, Jr.
Up by more than 23% in one month, shares of Eldorado Gold Corp. are outperforming .HUI and GDX by a wide margin.
Position: N/A
Donald W. Pendergast, Jr.
Donald W. Pendergast is a financial markets consultant who offers specialized services to stock brokers and high net worth individuals who seek a better bottom line for their portfolios.
PRINT THIS ARTICLE
CYCLES
Eldorado Gold Tops Relative Strength Among Gold Miners
08/28/12 02:37:16 PMby Donald W. Pendergast, Jr.
Up by more than 23% in one month, shares of Eldorado Gold Corp. are outperforming .HUI and GDX by a wide margin.
Position: N/A
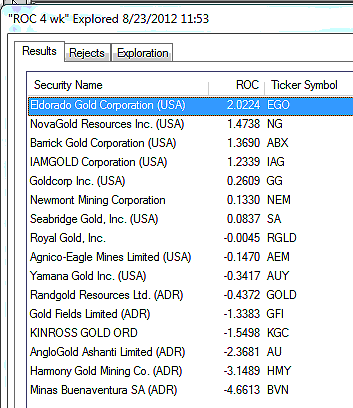
| Since the gold mining stocks have been doing so well for the last few weeks, it might be a great time to do the following: 1. Learn which gold miners are leading the pack higher in terms of relative strength 2. Determine what the key price cycles are suggesting in the weeks and months to come in the best-performing gold mining stock. Here's a look at the list of the gold stocks with the best four-week relative strength vs. the Market Vectors Gold Miners (GDX) exchange traded fund (ETF) and the cycle analysis of the best performer of all: Eldorado Gold Corp. (EGO) (Figure 1). |

|
| FIGURE 1: EGO. When compared to the most recent four-week performance of GDX, Eldorado Gold (EGO) has the highest relative strength of the 16 gold mining stocks shown here. |
| Graphic provided by: MetaStock. |
| Graphic provided by: MetaStock Explorer. |
| |
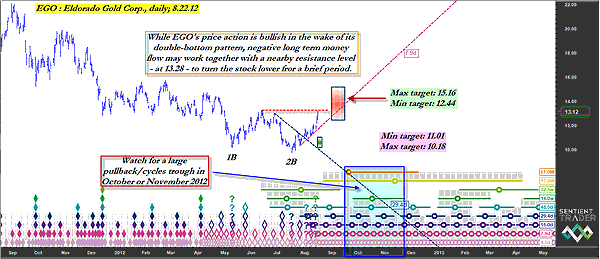
| Running a four-week rate of change (ROC) on a list of 16 heavily traded gold mining stocks reveals a wide range of over- and underperformance against GDX over the last four weeks of trading activity. Minas Buenaventuras (BVN) is in an actual downtrend and Harmony Gold Mining (HMY) is going sideways even as Eldorado Gold (EGO) has been tearing higher, far outpacing GDX and .HUI (AMEX Gold Bugs index). EGO's tremendous rally since July 23, 2012, begs the question: Is this current rise in the stock due to top out soon, and if so, what course of action should gold mining stock traders take? Some big-picture perspective is in order here before proceeding; technically, EGO is enjoying a near-term rally after breaking free from a nearly 11-month-old downtrend (that began on September 6, 2011, with the stock trading at 22.12). Longer term, EGO is in a primary bull market, one that launched in the wake of the devastating selloffs that finally ended on October 17, 2008. Long-term money flow based on the 100-day Chaikin money flow (CMF)(100) histogram is still negative but has shown signs of some positive divergence. Near term, EGO is at or very near to making a significant cycle high and is projected to reverse lower, making a cycle trough in the price range of 10.18 to 11.01 (see green time/price [TP] projection box). Obviously, if this cycle analysis is correct, EGO is due to make a sharp pullback soon. One clue that this might happen is if you see a daily close below the red dashed 7.9-day valid trendline (VTL) during last Thursday's or Friday's trading session; 11.75 would be a critical price level for this current uptrend to respect. See Figure 2. |

|
| FIGURE 2: EGO, DAILY. Going forward, EGO's rise up from a double-bottom pattern is very bullish, but with several lower-degree cycles expected to trough shortly, the stock may soon be destined to pull back below 11.00 before quickly rising again into the red time/price projection zone depicted on the chart. |
| Graphic provided by: Sentient Trader. |
| |
| Once EGO peaks and finds a tradable trough from which to rise, the cycles are suggesting that the stock may make its next cycle peak between September 7 and September 22, 2012; the expected price range for the peak is 12.44 to 15.16 (see the red time/price projection box). Remember that cycles trading isn't about seeking perfection. Rather, it's about seeking and profiting from a usable edge in the markets. When combined with other technical tools like relative strength and money flow analysis, cycles analysis can better help you understand how the pieces of the stock market puzzle all fit together -- most of the time, anyway. |
| In the meantime, it appears that EGO is on its first leg higher from a slightly off-kilter double-bottom pattern and is likely due to correct sooner rather than later. Any drops down into the green TP box should be viewed as a precursor to a new low-risk buying opportunity; consider using a mechanical trading system (with a good track record) to help time entries into EGO or any other gold stocks with favorable relative strength rankings, and be sure to limit your risk to 1% or 2% of your equity trading account's value. |
Donald W. Pendergast is a financial markets consultant who offers specialized services to stock brokers and high net worth individuals who seek a better bottom line for their portfolios.
| Title: | Writer, market consultant |
| Company: | Linear Trading Systems LLC |
| Jacksonville, FL 32217 | |
| Phone # for sales: | 904-239-9564 |
| E-mail address: | lineartradingsys@gmail.com |
Traders' Resource Links | |
| Linear Trading Systems LLC has not added any product or service information to TRADERS' RESOURCE. | |
Click here for more information about our publications!
PRINT THIS ARTICLE

Request Information From Our Sponsors
- VectorVest, Inc.
- Executive Premier Workshop
- One-Day Options Course
- OptionsPro
- Retirement Income Workshop
- Sure-Fire Trading Systems (VectorVest, Inc.)
- Trading as a Business Workshop
- VectorVest 7 EOD
- VectorVest 7 RealTime/IntraDay
- VectorVest AutoTester
- VectorVest Educational Services
- VectorVest OnLine
- VectorVest Options Analyzer
- VectorVest ProGraphics v6.0
- VectorVest ProTrader 7
- VectorVest RealTime Derby Tool
- VectorVest Simulator
- VectorVest Variator
- VectorVest Watchdog
- StockCharts.com, Inc.
- Candle Patterns
- Candlestick Charting Explained
- Intermarket Technical Analysis
- John Murphy on Chart Analysis
- John Murphy's Chart Pattern Recognition
- John Murphy's Market Message
- MurphyExplainsMarketAnalysis-Intermarket Analysis
- MurphyExplainsMarketAnalysis-Visual Analysis
- StockCharts.com
- Technical Analysis of the Financial Markets
- The Visual Investor
