HOT TOPICS LIST
- MACD
- Fibonacci
- RSI
- Gann
- ADXR
- Stochastics
- Volume
- Triangles
- Futures
- Cycles
- Volatility
- ZIGZAG
- MESA
- Retracement
- Aroon
INDICATORS LIST
LIST OF TOPICS
PRINT THIS ARTICLE
by Koos van der Merwe
"When in doubt, stay out." That is the mantra, but when a good company offers a 16.3% yield, temptation is there.
Position: Accumulate
Koos van der Merwe
Has been a technical analyst since 1969, and has worked as a futures and options trader with First Financial Futures in Johannesburg, South Africa.
PRINT THIS ARTICLE
RSI
Buying For Yield
08/27/12 09:26:28 AMby Koos van der Merwe
"When in doubt, stay out." That is the mantra, but when a good company offers a 16.3% yield, temptation is there.
Position: Accumulate
| Chorus Aviation Inc. (CHR'B) is listed on the Toronto Stock Exchange. As I write, its share price is quoted at $3.67 (B-share) with a yield of 16.3%. This looks good and is very interesting, but there is a "but." When something looks too good to be true, it usually is too good to be true. When we examine the fundamentals of the company, we see that there is a court case by Air Canada still to be settled. So how do investors feel about this? To help with this decision, let us look at the charts. |

|
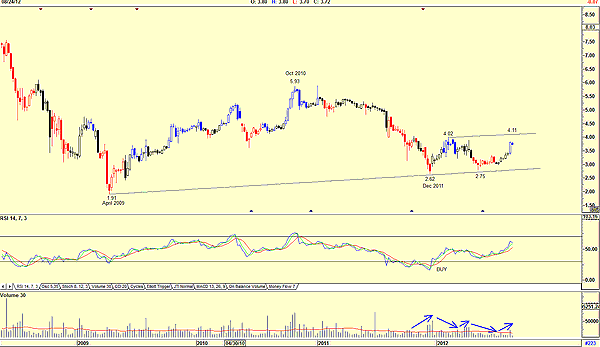
| FIGURE 1: CHORUS AVIATION, WEEKLY |
| Graphic provided by: AdvancedGET. |
| |
| Figure 1 is a weekly chart and shows the following: a. The price fell to a low of $1.91 by April 2009. It then rose to $5.93 by October 2010 and then fell to $2.62 by December 2011, forming a double bottom. b. The price has since moved in the trading range of $2.62 to $4.02. c. In December 2011, the chart shows that the relative strength index (RSI) has suggested a buy signal. The price did move from $2.62 on that signal, reaching a high of $4.02. The RSI is still bullish, suggesting that the price could move higher, possibly to test the upper resistance line at $4.11. d. Volume rose as the share price rose, a sign of strength, and fell as the price weakened, a sign of weakness. |

|
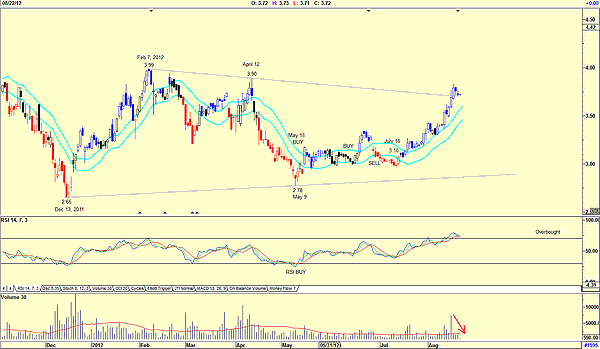
| FIGURE 2: CHORUS AVIATION, DAILY |
| Graphic provided by: AdvancedGET. |
| |
| Figure 2 is a daily chart and shows the following: a. The price fell to a low of $2.66 by December 13, 2011. It then rose to a high of $3.99 by February 7, 2012. b. The share price then fell to $2.78 by May 9 as fundamental uncertainty affected the share price. From that level, it has risen to its present price of $3.72. c. On May 9, with the share price at $2.78, the RSI gave a buy signal, which has proved very successful. However, the RSI is now at overbought levels, suggesting weakness ahead. d. Volume has recently been falling as the share price rose also suggesting weakness for the future. Note how the color of the candlesticks changed from red to blue on July 16, suggesting a buy signal that has proved very successful. One could therefore wait for the share price to change from blue to black or red before selling. Black is neutral, and red is a sell. Note also the buy signal given as the price broke above the upper JM internal band. I would not be a buyer of Chorus Aviation at present levels, even though the yield at the price of $3.69 is 16.3%. There are too many uncertainties present. However, I would place the share on my watchlist and buy once a buy signal is given, possibly with an RSI at oversold levels. |
Has been a technical analyst since 1969, and has worked as a futures and options trader with First Financial Futures in Johannesburg, South Africa.
| Address: | 3256 West 24th Ave |
| Vancouver, BC | |
| Phone # for sales: | 6042634214 |
| E-mail address: | petroosp@gmail.com |
Click here for more information about our publications!
PRINT THIS ARTICLE

Request Information From Our Sponsors
- StockCharts.com, Inc.
- Candle Patterns
- Candlestick Charting Explained
- Intermarket Technical Analysis
- John Murphy on Chart Analysis
- John Murphy's Chart Pattern Recognition
- John Murphy's Market Message
- MurphyExplainsMarketAnalysis-Intermarket Analysis
- MurphyExplainsMarketAnalysis-Visual Analysis
- StockCharts.com
- Technical Analysis of the Financial Markets
- The Visual Investor
- VectorVest, Inc.
- Executive Premier Workshop
- One-Day Options Course
- OptionsPro
- Retirement Income Workshop
- Sure-Fire Trading Systems (VectorVest, Inc.)
- Trading as a Business Workshop
- VectorVest 7 EOD
- VectorVest 7 RealTime/IntraDay
- VectorVest AutoTester
- VectorVest Educational Services
- VectorVest OnLine
- VectorVest Options Analyzer
- VectorVest ProGraphics v6.0
- VectorVest ProTrader 7
- VectorVest RealTime Derby Tool
- VectorVest Simulator
- VectorVest Variator
- VectorVest Watchdog
