HOT TOPICS LIST
- MACD
- Fibonacci
- RSI
- Gann
- ADXR
- Stochastics
- Volume
- Triangles
- Futures
- Cycles
- Volatility
- ZIGZAG
- MESA
- Retracement
- Aroon
INDICATORS LIST
LIST OF TOPICS
PRINT THIS ARTICLE
by Donald W. Pendergast, Jr.
Shares of Apple Inc. are at all-time highs again, but this latest rally is fast approaching a likely cycle high.
Position: N/A
Donald W. Pendergast, Jr.
Donald W. Pendergast is a financial markets consultant who offers specialized services to stock brokers and high net worth individuals who seek a better bottom line for their portfolios.
PRINT THIS ARTICLE
CYCLES
AAPL Close To The Summit?
08/27/12 03:18:34 PMby Donald W. Pendergast, Jr.
Shares of Apple Inc. are at all-time highs again, but this latest rally is fast approaching a likely cycle high.
Position: N/A
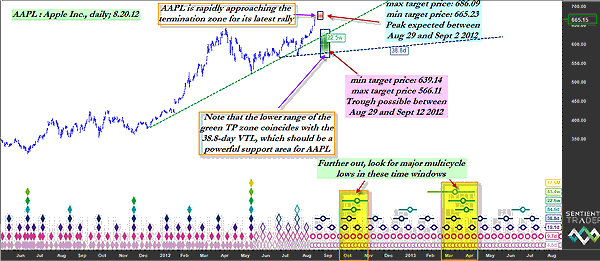
| The performance of Apple Inc.'s (AAPL) common stock over the past nine months has been nothing short of extraordinary, with the valuation of the shares rising from about $360 to more than $665 during that time. For a large-cap (actually, a giant-cap) stock, that's a pretty amazing annualized rate of return, one that few other big caps can ever hope to attain. With some analysts now forecasting AAPL to top $725 by year-end, it might be helpful to look at AAPL's daily chart (Figure 1) to see if the price cycle trends in the stock also concur with such rosy price appreciation predictions. Here's a closer look now. |

|
| FIGURE 1: AAPL, DAILY. With cycles analysis projecting major cyclical peaks not only in shares of AAPL but also in the .OEX and .SPX, now may be a good time to assess your portfolio's risk exposure should there be a sudden reversal lower. |
| Graphic provided by: Sentient Trader. |
| |
| There are times when one of the lowest-risk trades around is to buy a break above a previous all-time high in a large-cap stock that has favorable earnings growth potential, provided that a trader treats the trade as an in-and-out, short-term play designed to capitalize on investor frenzy and media hype. That tactic surely would have proved profitable when AAPL surged above its April 10, 2012, high of 644.00 during trading on August 17, 2012, and hopefully, the traders who did have already closed out their positions and are counting their gains. But for those traders and investors who bought the break above 644.00, time may be quickly running out for them to scale out of or more closely trail their positions. That's because exhaustive multicycle analysis is projecting that AAPL is due to make a significant swing high between August 25 and September 2, 2012; the minimum price target for the cycle high is 665.23 (which has already been achieved) and the maximum price target is 686.09. Given that AAPL is beginning to get that all-too-familiar parabolic look again, it might be a very wise strategy for existing longs in this stock to begin to craft a rational exit strategy now -- before a sudden reversal comes along, bringing confusion, fear and panic-driven responses in its wake. Coincident with the upcoming cycle high forecast is the disturbingly bearish short-, medium-, and long-term money flow trends (using various measurements in the daily chart's Chaikin money flow indicator) in AAPL. This stock is under heavy distribution by the smart money, so don't be one of their suckers who buys their offerings of AAPL at such an inflated price unless you are a committed long-term investor who truly understands AAPL's company fundamentals. Swing traders should simply stand aside for now and let the inevitable correction play out before considering taking a new long position -- cycles analysis is suggesting that AAPL may make a significant cycle trough sometime between August 29, 2012, and September 12, 2012; the expected price range is rather wide (566.11 to 639.14), but that is reasonable, since no one (not even advanced technical software or artificial intelligence) can know if AAPL is simply going to have a short yet sharp correction as part of the current long-term uptrend or if the soon-to-arrive turn will be the start of a multimonth trend reversal -- one that may take the stock down by $100 or even $150 per share or more. See Figure 2. If you look at the lower right portion of the chart, you can see that the software has identified two future time windows in which to anticipate the formation of major multicycle lows -- October-November 2012 and March-April 2013. If the anticipated September swoon in AAPL is especially bearish, then it's entirely possible that an even lower low is due for October-November 2012 -- perhaps not good news for an incumbent President and his administration's re-election prospects. |

|
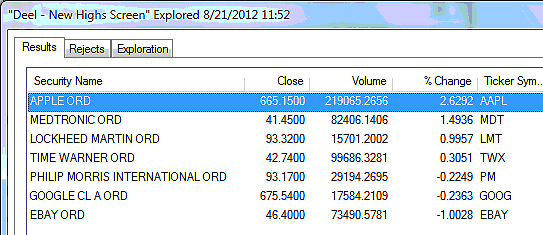
| FIGURE 2: OEX COMPONENTS. The seven .OEX components making new multimonth/multiyear highs as of August 20, 2012. |
| Graphic provided by: MetaStock. |
| Graphic provided by: MetaStock Explorer. |
| |
| While it's too risky to attempt to milk further short-term gains in AAPL now, really skilled short-sellers might try to short on a break of AAPL's 19.1-day valid trendline (VTL), which is right near the 660.00 area. A good, logical price target for such a short might be the upper portion of the green time/price projection box, right near where the stock's 22.5-week VTL intersects at the 630.00 level. You can trade that hypothetical move with slightly in-the-money puts with two to three months of time value or you could just short the shares outright, it's your call to make. Just keep your risks small and your wits about you, knowing how dangerous a short squeeze can be to your trading account's health. |
Donald W. Pendergast is a financial markets consultant who offers specialized services to stock brokers and high net worth individuals who seek a better bottom line for their portfolios.
| Title: | Writer, market consultant |
| Company: | Linear Trading Systems LLC |
| Jacksonville, FL 32217 | |
| Phone # for sales: | 904-239-9564 |
| E-mail address: | lineartradingsys@gmail.com |
Traders' Resource Links | |
| Linear Trading Systems LLC has not added any product or service information to TRADERS' RESOURCE. | |
Click here for more information about our publications!
PRINT THIS ARTICLE

Request Information From Our Sponsors
- StockCharts.com, Inc.
- Candle Patterns
- Candlestick Charting Explained
- Intermarket Technical Analysis
- John Murphy on Chart Analysis
- John Murphy's Chart Pattern Recognition
- John Murphy's Market Message
- MurphyExplainsMarketAnalysis-Intermarket Analysis
- MurphyExplainsMarketAnalysis-Visual Analysis
- StockCharts.com
- Technical Analysis of the Financial Markets
- The Visual Investor
- VectorVest, Inc.
- Executive Premier Workshop
- One-Day Options Course
- OptionsPro
- Retirement Income Workshop
- Sure-Fire Trading Systems (VectorVest, Inc.)
- Trading as a Business Workshop
- VectorVest 7 EOD
- VectorVest 7 RealTime/IntraDay
- VectorVest AutoTester
- VectorVest Educational Services
- VectorVest OnLine
- VectorVest Options Analyzer
- VectorVest ProGraphics v6.0
- VectorVest ProTrader 7
- VectorVest RealTime Derby Tool
- VectorVest Simulator
- VectorVest Variator
- VectorVest Watchdog
