HOT TOPICS LIST
- MACD
- Fibonacci
- RSI
- Gann
- ADXR
- Stochastics
- Volume
- Triangles
- Futures
- Cycles
- Volatility
- ZIGZAG
- MESA
- Retracement
- Aroon
INDICATORS LIST
LIST OF TOPICS
PRINT THIS ARTICLE
by Donald W. Pendergast, Jr.
The .OEX continues to grind higher; once again, the maximum price target for the June through August rally has been increased.
Position: N/A
Donald W. Pendergast, Jr.
Donald W. Pendergast is a financial markets consultant who offers specialized services to stock brokers and high net worth individuals who seek a better bottom line for their portfolios.
PRINT THIS ARTICLE
TECHNICAL ANALYSIS
PENDY'S PICKS: August 21, 2012
08/21/12 09:17:21 AMby Donald W. Pendergast, Jr.
The .OEX continues to grind higher; once again, the maximum price target for the June through August rally has been increased.
Position: N/A
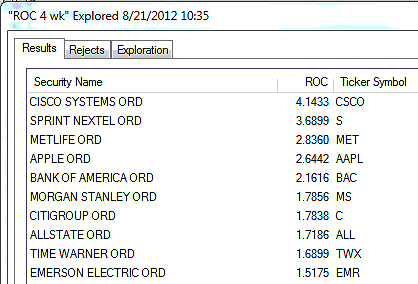
| The .OEX (Standard & Poor's 100) finished Monday's trading session at 652.23, closing marginally higher -- up by 0.099 %. The 33.8-week cycle in this large-cap index simply refuses to peter out, having been the primary bullish driver in this powerfully persistent rally. This cycle is still expected to peak near September 1, 2012; the maximum target price for the June through August 2012 rally has again been raised -- this time to 747.05 -- yet the rally still has a major cycle peak date of no later than September 4, 2012. Expect market volatility to increase substantially once the .OEX and .SPX finally roll over; September should offer many opportunities for nimble, watchful short-sellers. Figure 1 shows us the strongest four-week relative strength (RS) performers in the .OEX; Cisco Systems (CSCO) has again vaulted into the top ranking slot, with Sprint Nextel (S) dropping to second. This high-flier had a sharp intraday pullback yesterday, recovering by the close of the session. This stock is very vulnerable to a proportional correction once the broad markets roll over, with major support levels near 4.85 and 4.26. Apple Inc. (AAPL) has now appeared on the top 10 RS list, making a new all-time high in the process. Look for AAPL to get whacked in September, as there is a major bearish price/money flow divergence in place on its daily chart, one that is forecasting major pain for recent buyers (within the last two weeks or so) of this stock. This top-ranked list now includes five financial sector biggies: BAC, MS, C, MET, and ALL -- financials are the key driver in any bull rally or bear decline in the .OEX and .SPX, so look for the financials to help lead the way lower in September. By the way, if you are a near-term large-cap covered-call trader, you would do well to stop putting on new positions until the market finds a new multicycle low in the next four to six weeks. |

|
| FIGURE 1: STRONGEST COMPONENTS. The 10 strongest S&P 100 (.OEX) components over the past month, as of Monday, August 20, 2012. |
| Graphic provided by: MetaStock. |
| Graphic provided by: MetaStock Explorer. |
| |
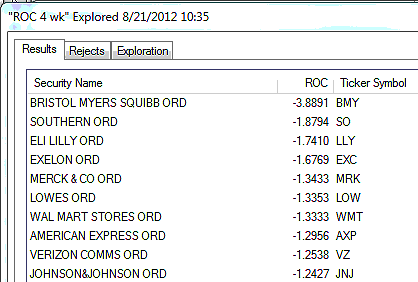
| Figure 2 is a look at the weakest four-week relative strength performers in the .OEX; four health-care sector giants appear on the list -- Bristol Myers Squibb (BMY), Merck (MRK), Eli Lilly (LLY), and Johnson & Johnson (JNJ). The presence of these stocks could be a kind of bear market bellwether, one that is hinting at the upcoming reversal in the .OEX. Excelon (EXC) and Southern Co.'s (SO) presence on the weak RS list reveals weakness in various parts of the electric utility complex. Wal-Mart Stores (WMT) is looking very vulnerable, seeing that it recently printed a bearish gap after a large run higher; 67.00 may prove to be solid support as the stock seeks to make a multicycle low with the rest of the broad market by late September-early October 2012. |

|
| FIGURE 2: WEAKEST COMPONENTS. The 10 weakest S&P 100 (.OEX) components over the past month, as of Monday, August 20, 2012. |
| Graphic provided by: TeleChart2007. |
| Graphic provided by: MetaStock Explorer. |
| |
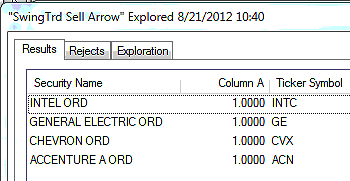
| Figure 3 are the S&P 100 components giving RMO swing sell setup signals; 4% of the .OEX components issued new RMO swing sell signals on Monday; and there was also one new swing buy setup in CVS Caremark (CVS). Among the sell setups, Chevron (CVX) looks very interesting. The stock recently broke above a long-standing resistance area near 109.00-111.00 and is currently trading above 112.00. If CVX declines below 112.14, expect a quick retest of the 110.00 area; this could be a great short-term put option play for skilled traders. Expect many other big oil and oil services stocks to take a tumble as we move into September as crude oil makes another swing high and then reverses back down to the sub-90.00 level. General Electric (GE) also looks weak here; expect a near-term decline before the stock makes another attempt to reach its February 2011 high of 21.65. |

|
| FIGURE 3: SWING SELL SIGNALS. The S&P 100 (.OEX) components issuing RMO swing sell signals at the close of trading on Monday, August 20, 2012; 4% of all .OEX components fired swing sell setup signals during this session, with one new swing buy setup signal also being issued. |
| Graphic provided by: MetaStock. |
| Graphic provided by: MetaStock Explorer. |
| |
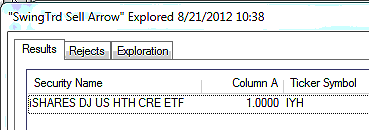
| Among exchange traded funds (ETFs), there was one new swing sell signal, the iShares Health Care Sector (IYH) ETF (Figure 4). A decline below 80.74 triggers a new short entry here. There were no new buy setups in any ETF on Monday. |

|
| FIGURE 4: SELL SETUP SIGNAL. The one ETF that fired a new sell setup signal as of the close of trading on Monday, August 20, 2012; there were no new buy setup signals on Monday. |
| Graphic provided by: MetaStock. |
| Graphic provided by: MetaStock Explorer. |
| |
| The .OEX was able to add a bit more of a gain on Monday, closing fractionally higher. The powerful 33.8-week cycle continues to provide surprises to the upside, but there is little reason to expect the current rally to extend beyond the cycle forecasts call for a break lower by no later than September 4, 2012. The maximum price target for the move that commenced on June 4, 2012, has been raised to 747.05, but it seems rather unlikely for the .OEX to tack on another 95-point gain in the next two weeks. As always, trade wisely until we meet here again. |
Donald W. Pendergast is a financial markets consultant who offers specialized services to stock brokers and high net worth individuals who seek a better bottom line for their portfolios.
| Title: | Writer, market consultant |
| Company: | Linear Trading Systems LLC |
| Jacksonville, FL 32217 | |
| Phone # for sales: | 904-239-9564 |
| E-mail address: | lineartradingsys@gmail.com |
Traders' Resource Links | |
| Linear Trading Systems LLC has not added any product or service information to TRADERS' RESOURCE. | |
Click here for more information about our publications!
PRINT THIS ARTICLE

Request Information From Our Sponsors
- StockCharts.com, Inc.
- Candle Patterns
- Candlestick Charting Explained
- Intermarket Technical Analysis
- John Murphy on Chart Analysis
- John Murphy's Chart Pattern Recognition
- John Murphy's Market Message
- MurphyExplainsMarketAnalysis-Intermarket Analysis
- MurphyExplainsMarketAnalysis-Visual Analysis
- StockCharts.com
- Technical Analysis of the Financial Markets
- The Visual Investor
- VectorVest, Inc.
- Executive Premier Workshop
- One-Day Options Course
- OptionsPro
- Retirement Income Workshop
- Sure-Fire Trading Systems (VectorVest, Inc.)
- Trading as a Business Workshop
- VectorVest 7 EOD
- VectorVest 7 RealTime/IntraDay
- VectorVest AutoTester
- VectorVest Educational Services
- VectorVest OnLine
- VectorVest Options Analyzer
- VectorVest ProGraphics v6.0
- VectorVest ProTrader 7
- VectorVest RealTime Derby Tool
- VectorVest Simulator
- VectorVest Variator
- VectorVest Watchdog
