HOT TOPICS LIST
- MACD
- Fibonacci
- RSI
- Gann
- ADXR
- Stochastics
- Volume
- Triangles
- Futures
- Cycles
- Volatility
- ZIGZAG
- MESA
- Retracement
- Aroon
INDICATORS LIST
LIST OF TOPICS
PRINT THIS ARTICLE
by Donald W. Pendergast, Jr.
Shares of Lockheed Martin are up by nearly 40% since August 2011; cycles and money flow analysis suggest that a pullback is due soon.
Position: N/A
Donald W. Pendergast, Jr.
Donald W. Pendergast is a financial markets consultant who offers specialized services to stock brokers and high net worth individuals who seek a better bottom line for their portfolios.
PRINT THIS ARTICLE
ACCUM./DIST. CHAIKIN
Lockheed Martin Close To A Top?
08/27/12 09:16:39 AMby Donald W. Pendergast, Jr.
Shares of Lockheed Martin are up by nearly 40% since August 2011; cycles and money flow analysis suggest that a pullback is due soon.
Position: N/A
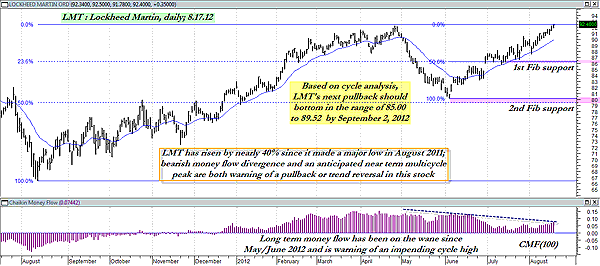
| Stocks from the defense/aerospace industry groups can and do make powerful trending moves -- in either direction -- and tend to offer skilled traders and investors plentiful opportunities to latch on to tradable moves. Lockheed Martin shares (LMT) certainly look trendworthy enough, based on its astounding rise between August 2011 and April 2012; the stock is now trading above its April 26, 2012, high of 92.24 and is attracting plenty of investor attention. However, two key technical studies are suggesting that LMT is very likely to experience a noticeable pullback and/or trend reversal. Here's a look at LMT now (Figures 1 and 2). |

|
| FIGURE 1: LMT, DAILY. When several key price cycles in a bullish trending stock are due to peak at the same approximate time and its medium- and long-term money flows are significantly diverging from price, savvy traders will recognize these as early warnings of an impending trend reversal. |
| Graphic provided by: MetaStock. |
| |
| When powerful, longer-term price cycles are continuing to rise, it's not uncommon for a stock to make a new high before pulling back in a proportional retracement and then making another run at the previous high -- which is exactly the scenario we see on LMT's daily chart (Figure 1). The stock has been driven higher by its 22.2-month cycle, but that cycle is has already begun to peak even as its 75-day cycle has turned down. Of technical importance is the continuing degradation of LMT's long-term money flow trend; based on its 100-day Chaikin money flow (CMF)(100) histogram, a noticeably bearish price/money flow divergence has been under way since the latter part of May 2012 and that means that this latest push higher in the stock probably is getting close to its exhaustion point. Yes, it can and might continue to run a dollar or two higher, but the percentages are heavily stacked against a continuation of this particular trend thrust. Cycles analysis has identified the time window between August 20, 2012, and September 2, 2012, as the most likely period to expect LMT to bottom into a multicycle low. The projected price range for the upcoming trough is between 85.00 and 89.52. This means that it's probably close to the time to issue an "everybody out of the pool" notice for those already holding long positions in LMT. When the price cycles are indicating a near-term pullback at the same time that both long-term and medium-term money flows are diverging from price, you have a truly powerful early warning mechanism that can help defend your portfolio from needless enemy attack -- the enemy being, of course, the mean old bear market himself. |

|
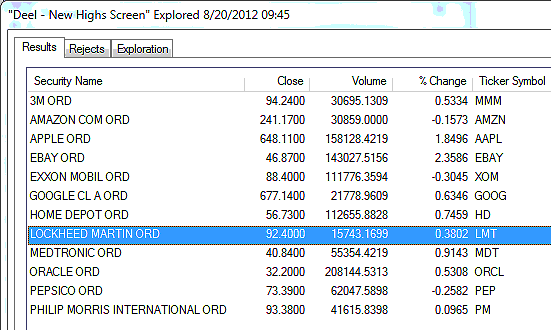
| FIGURE 2: OEX COMPONENT STOCKS. The 12 .OEX component stocks making new multimonth/multiyear highs as of August 17, 2012. |
| Graphic provided by: MetaStock. |
| Graphic provided by: Deel New Highs Screen from MetaStock 11. |
| |
| LMT's medium-term picture is a bit rosier, however. After it makes its anticipated cycle low, it is then projected to rise within the range of 91.65 to 98.14 before peaking again between September 16 and September 26, 2012. Cycles analysis doesn't necessarily provide traders/investors with pinpoint turning dates/prices, but it still does a very good job of projecting high probability time/price zones in which a tradable cycle high or low is likely to be achieved. The bottom line in the case of LMT is that existing longs should already be scaling out or running very close trailing stops. Bulls should wait for LMT to drop into its aforementioned cycle trough before looking for suitable mechanical long entry signals, risking no more than 1% to 2% of their account value on such trades. |
Donald W. Pendergast is a financial markets consultant who offers specialized services to stock brokers and high net worth individuals who seek a better bottom line for their portfolios.
| Title: | Writer, market consultant |
| Company: | Linear Trading Systems LLC |
| Jacksonville, FL 32217 | |
| Phone # for sales: | 904-239-9564 |
| E-mail address: | lineartradingsys@gmail.com |
Traders' Resource Links | |
| Linear Trading Systems LLC has not added any product or service information to TRADERS' RESOURCE. | |
Click here for more information about our publications!
PRINT THIS ARTICLE

Request Information From Our Sponsors
- StockCharts.com, Inc.
- Candle Patterns
- Candlestick Charting Explained
- Intermarket Technical Analysis
- John Murphy on Chart Analysis
- John Murphy's Chart Pattern Recognition
- John Murphy's Market Message
- MurphyExplainsMarketAnalysis-Intermarket Analysis
- MurphyExplainsMarketAnalysis-Visual Analysis
- StockCharts.com
- Technical Analysis of the Financial Markets
- The Visual Investor
- VectorVest, Inc.
- Executive Premier Workshop
- One-Day Options Course
- OptionsPro
- Retirement Income Workshop
- Sure-Fire Trading Systems (VectorVest, Inc.)
- Trading as a Business Workshop
- VectorVest 7 EOD
- VectorVest 7 RealTime/IntraDay
- VectorVest AutoTester
- VectorVest Educational Services
- VectorVest OnLine
- VectorVest Options Analyzer
- VectorVest ProGraphics v6.0
- VectorVest ProTrader 7
- VectorVest RealTime Derby Tool
- VectorVest Simulator
- VectorVest Variator
- VectorVest Watchdog
