HOT TOPICS LIST
- MACD
- Fibonacci
- RSI
- Gann
- ADXR
- Stochastics
- Volume
- Triangles
- Futures
- Cycles
- Volatility
- ZIGZAG
- MESA
- Retracement
- Aroon
INDICATORS LIST
LIST OF TOPICS
PRINT THIS ARTICLE
by Donald W. Pendergast, Jr.
Shares of Oracle Corp. have been on a three-month long bullish tear, but cycles analysis suggests that the move may be entering its terminal phase.
Position: N/A
Donald W. Pendergast, Jr.
Donald W. Pendergast is a financial markets consultant who offers specialized services to stock brokers and high net worth individuals who seek a better bottom line for their portfolios.
PRINT THIS ARTICLE
CYCLES
Oracle Approaching A Multicycle High
08/24/12 08:30:10 AMby Donald W. Pendergast, Jr.
Shares of Oracle Corp. have been on a three-month long bullish tear, but cycles analysis suggests that the move may be entering its terminal phase.
Position: N/A
| Oracle Corp. (ORCL) shares tend to make powerful swing moves on a regular basis, making it a stock well suited to cyclical analysis. The stock looks very strong right now, but what are the cycles telling us may be up just ahead? Here's a closer look at ORCL now (Figures 1 and 2). |

|
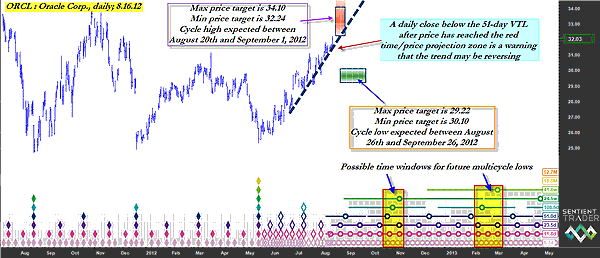
| FIGURE 1: ORCL, DAILY. ORCL appears to be rapidly closing in on its next time/price projection window (red box) for making a significant cycle high. If the peak and subsequent bearish turn occurs as anticipated, the green zone on the chart offers some time/projections for the stock's next significant cycle lows to occur. |
| Graphic provided by: Sentient Trader. |
| |
| Up by more than 27% since making a major multicycle low (with eight cycles bottoming simultaneously) on May 18, 2012, ORCL has risen in a fairly straight and regular trend channel in which pullbacks have been modest and rebounds have been sharp. Naturally, the higher that a move like this goes, the more interested the investing public becomes; however, even a casual look at ORCL's price cycles reveals that the stock is likely much closer to the end of this powerful multimonth move and that a proportional correction will ensue within the next two to five weeks. The red time/price projection box is calculating that ORCL should top out at a price between 32.24 and 34.10 and this peak should occur sometime between August 20 and September 1, 2012. That means that there's only about two weeks left before this major swing move should terminate and pull back and/or reverse, and any existing long positions in this stock need to be protected and/or scaled out of. The dashed blue trendline is the 51-day (VTL) and it is the most useful line in the sand for those wanting to determine if the nominal 40-day (in this case, the actual cycle length is 51 days) cycle top is in place. If you see a daily close below this trendline -- particularly if ORCL manages to make a daily close within the red box first -- then you have a very powerful confirmation that the 40-day cycle is already in. |

|
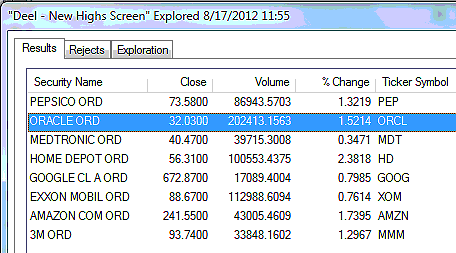
| FIGURE 2: OEX COMPONENTS. The .OEX components making new multimonth or multiyear highs on Thursday, August 16, 2012. |
| Graphic provided by: MetaStock. |
| Graphic provided by: MetaStock Explorer. |
| |
| Knowing that the nominal 40-day cycle in ORCL has peaked is one thing, but what happens after that? The software has also projected some time/price calculations regarding the next multicycle low in the stock; it is showing that the low is expected to be made sometime between August 26 and September 26, 2012, with a maximum price target of 29.22 and a minimum price target of 30.10. Going out further, the software has also identified two other time windows in which to expect meaningful multicycle lows: the first one is sometime between mid-October and mid-November 2012 and the one after that occurring sometime between early February and mid-March 2013. These cyclical projections are in agreement with those of the .OEX and .SPX; late August-early September 2012 is still the expected cycle peak window for these big stock indexes. |
| Buying the December $32 puts (selling for about $1.85 as this is written) on a break below the 51-day valid trendline (VTL) offers ORCL the following advantages: 1. Four months of option time value (minimum daily time decay) 2. The stock's next support level is at 29.74, this potential profit target (on a bearish selloff) is more than $2 below the strike price of the put 3. The timing of a long put play is far less critical than that of a stock-only position, easing the stress level on traders in this stock. If buying the December $32 puts, be sure you consider taking at least partial profits near the last swing low of 29.74 and/or the max target price for the next cycle low, which is 29.22. Limit your risk to 1% or 2% of the value of your account on this trade, as always, and realize that limiting your risk is job #1 on every trade, no matter how bullish or bearish it may look on the charts. |
Donald W. Pendergast is a financial markets consultant who offers specialized services to stock brokers and high net worth individuals who seek a better bottom line for their portfolios.
| Title: | Writer, market consultant |
| Company: | Linear Trading Systems LLC |
| Jacksonville, FL 32217 | |
| Phone # for sales: | 904-239-9564 |
| E-mail address: | lineartradingsys@gmail.com |
Traders' Resource Links | |
| Linear Trading Systems LLC has not added any product or service information to TRADERS' RESOURCE. | |
Click here for more information about our publications!
PRINT THIS ARTICLE

|

Request Information From Our Sponsors
- StockCharts.com, Inc.
- Candle Patterns
- Candlestick Charting Explained
- Intermarket Technical Analysis
- John Murphy on Chart Analysis
- John Murphy's Chart Pattern Recognition
- John Murphy's Market Message
- MurphyExplainsMarketAnalysis-Intermarket Analysis
- MurphyExplainsMarketAnalysis-Visual Analysis
- StockCharts.com
- Technical Analysis of the Financial Markets
- The Visual Investor
- VectorVest, Inc.
- Executive Premier Workshop
- One-Day Options Course
- OptionsPro
- Retirement Income Workshop
- Sure-Fire Trading Systems (VectorVest, Inc.)
- Trading as a Business Workshop
- VectorVest 7 EOD
- VectorVest 7 RealTime/IntraDay
- VectorVest AutoTester
- VectorVest Educational Services
- VectorVest OnLine
- VectorVest Options Analyzer
- VectorVest ProGraphics v6.0
- VectorVest ProTrader 7
- VectorVest RealTime Derby Tool
- VectorVest Simulator
- VectorVest Variator
- VectorVest Watchdog
