HOT TOPICS LIST
- MACD
- Fibonacci
- RSI
- Gann
- ADXR
- Stochastics
- Volume
- Triangles
- Futures
- Cycles
- Volatility
- ZIGZAG
- MESA
- Retracement
- Aroon
INDICATORS LIST
LIST OF TOPICS
PRINT THIS ARTICLE
by Koos van der Merwe
PetroBakken Energy Ltd. operates as a light oil exploration and production company in western Canada. Worth a look?
Position: Accumulate
Koos van der Merwe
Has been a technical analyst since 1969, and has worked as a futures and options trader with First Financial Futures in Johannesburg, South Africa.
PRINT THIS ARTICLE
Shining A Light On Petrobakken
08/23/12 09:14:27 AMby Koos van der Merwe
PetroBakken Energy Ltd. operates as a light oil exploration and production company in western Canada. Worth a look?
Position: Accumulate
| The price of oil. We all know that the world lives with oil, a commodity that we cannot do without. With the news that Israel is seriously considering attacking Iran before the November US Presidential election, speculation is rife about the oil price rising. Of course, the simple fact that the world is talking about an Israeli attack suggests that it will not happen. Israel rarely makes its intentions known. What is therefore making Petrobakken attractive could be anyone's guess: a new oil find? A takeover? Who knows. However, the charts do look interesting. |

|
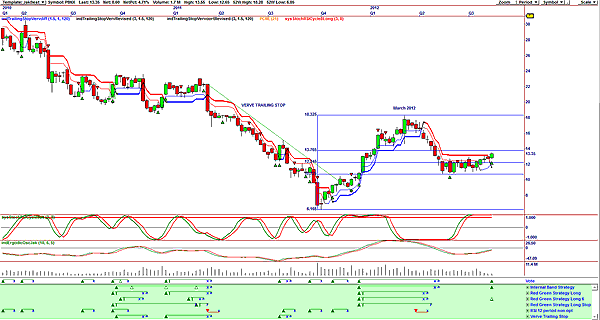
| FIGURE 1: PBN, WEEKLY |
| Graphic provided by: OmniTrader. |
| |
| Figure 1 is a weekly chart of Petrobakken (PBN). The chart shows that the vote line, a summation of the JM internal band strategy and the red-green strategy long 6. The price has also moved above the Verve trailing stop. Note how the price moved from a low of $6.165 to a high of $18.325 by March 2012. The price then fell to the 50% Fibonacci retracement level at $10.725, a strong positive signal. The ergodic oscillator is also positive. Two negatives are the stochastic RSI cycle oscillator, which is at overbought levels, and volume, which fell as the share price rose. |

|
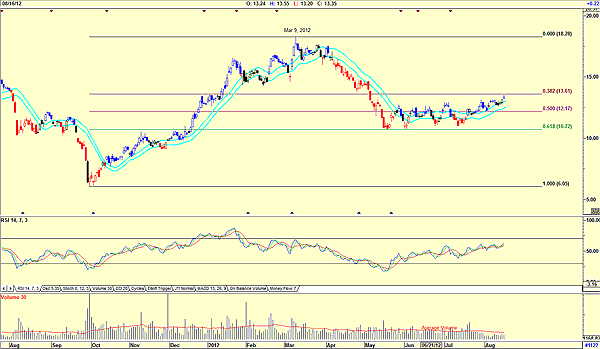
| FIGURE 2: PBN, DAILY. This chart shows strength. |
| Graphic provided by: AdvancedGET. |
| |
| Figure 2 is a daily chart, and shows how the price is testing the 38.2% retracement level. Volume is still below the average volume level and hardly moved as the price rose. However, the relative strength index (RSI) is moving up, suggesting that the price could retest the high of $18.28 of March 9. I would be a buyer of Petrobakken on any correction, with a target price of $18.28. |
Has been a technical analyst since 1969, and has worked as a futures and options trader with First Financial Futures in Johannesburg, South Africa.
| Address: | 3256 West 24th Ave |
| Vancouver, BC | |
| Phone # for sales: | 6042634214 |
| E-mail address: | petroosp@gmail.com |
Click here for more information about our publications!
PRINT THIS ARTICLE

Request Information From Our Sponsors
- VectorVest, Inc.
- Executive Premier Workshop
- One-Day Options Course
- OptionsPro
- Retirement Income Workshop
- Sure-Fire Trading Systems (VectorVest, Inc.)
- Trading as a Business Workshop
- VectorVest 7 EOD
- VectorVest 7 RealTime/IntraDay
- VectorVest AutoTester
- VectorVest Educational Services
- VectorVest OnLine
- VectorVest Options Analyzer
- VectorVest ProGraphics v6.0
- VectorVest ProTrader 7
- VectorVest RealTime Derby Tool
- VectorVest Simulator
- VectorVest Variator
- VectorVest Watchdog
- StockCharts.com, Inc.
- Candle Patterns
- Candlestick Charting Explained
- Intermarket Technical Analysis
- John Murphy on Chart Analysis
- John Murphy's Chart Pattern Recognition
- John Murphy's Market Message
- MurphyExplainsMarketAnalysis-Intermarket Analysis
- MurphyExplainsMarketAnalysis-Visual Analysis
- StockCharts.com
- Technical Analysis of the Financial Markets
- The Visual Investor
