

HOT TOPICS LIST
- MACD
- Fibonacci
- RSI
- Gann
- ADXR
- Stochastics
- Volume
- Triangles
- Futures
- Cycles
- Volatility
- ZIGZAG
- MESA
- Retracement
- Aroon
INDICATORS LIST
LIST OF TOPICS
PRINT THIS ARTICLE
by Donald W. Pendergast, Jr.
The .OEX gave the bulls a pleasant surprise on Thursday when it staged yet another bullish breakout; maximum price targets have been raised slightly as a result.
Position: N/A
Donald W. Pendergast, Jr.
Donald W. Pendergast is a financial markets consultant who offers specialized services to stock brokers and high net worth individuals who seek a better bottom line for their portfolios.
PRINT THIS ARTICLE
TECHNICAL ANALYSIS
PENDY'S PICKS: August 17, 2012
08/17/12 10:21:49 AMby Donald W. Pendergast, Jr.
The .OEX gave the bulls a pleasant surprise on Thursday when it staged yet another bullish breakout; maximum price targets have been raised slightly as a result.
Position: N/A
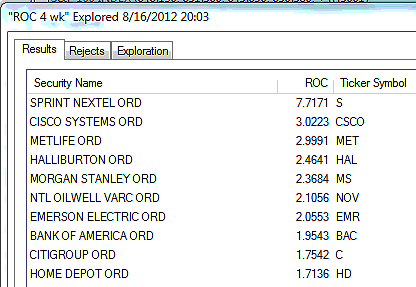
| The .OEX (Standard & Poor's 100) finished Thursday's trading session at 650.58, closing up by 0.79%. Each time these bullish steps higher occur, it confirms the fact that it is still the 33.8-week cycle in the index that is doing all the heavy lifting. This cycle is still expected to peak sometime in the next several weeks; the maximum target price for the June through August 2012 rally has now been raised to 731.74 with a termination date of no later than September 4, 2012. There is no change in the expectation of a sizable correction in September, however. Figure 1 shows us the strongest four-week relative strength (RS) performers in the .OEX; Cisco Systems (CSCO) has rocketed into second place in the rankings. Yesterday's powerful rally was very kind to this tech staple's share price. Sprint Nextel (S) will continue its parabolic rise if 5.49 is exceeded soon; be careful if considering going long at this late stage of the rally. However, a correction will probably just come out of nowhere when this stock finally decides to take a breather. Home Depot (HD) is another newcomer to the top 10 RS list; since most stocks move higher or lower based on revisions in earnings growth rates, perhaps the outlook for HD's sales and earnings will have a favorable trend for the next six to 12 months. |
|
| FIGURE 1: STRONGEST COMPONENTS. The 10 strongest S&P 100 (.OEX) components over the past month, as of Thursday, August 16, 2012. |
| Graphic provided by: MetaStock. |
| Graphic provided by: MetaStock Explorer. |
| |
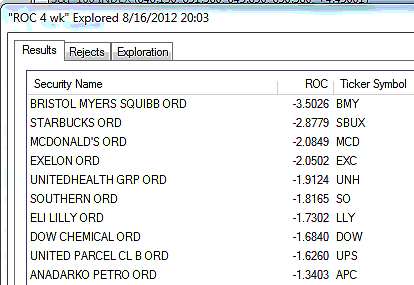
| Figure 2 is a look at the weakest four-week relative strength performers in the .OEX. As you may realize, the stocks on this particular list tend to move more slowly than those on the strong RS list, perhaps confirming that weak stocks usually stay weaker than strong stocks stay strong. Starbucks (SBUX) still looks like it needs another cup of joe, and Bristol Myers Squibb (BMY) also appears to be in need of a happy pill from the doctor in the form of value-hungry investors seeking to buy beaten-down large caps with a promising future. Southern Co. (SO) is rising on this weak RS stock list, while Dow Chemical (DOW) and United Health Group (UNH) continue to make themselves right at home here. Excelon's (EXC) daily chart pattern looks horrific, leaving little doubt as to why it is here on our weak RS stock list. |
|
| FIGURE 2: WEAKEST COMPONENTS. The 10 weakest S&P 100 (.OEX) components over the past month, as of Thursday, August 16, 2012. |
| Graphic provided by: MetaStock. |
| Graphic provided by: MetaStock Explorer. |
| |
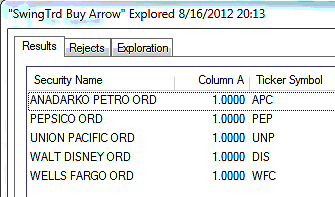
| Figure 3 are the S&P 100 components giving RMO swing buy setup signals; 5% of the .OEX components issued new RMO swing buy signals on Thursday. There were also two new swing sell setups in Baker Hughes (BHI) and Occidental Petroleum (OXY). These two sell setups from the energy sector come after the oil exploration/production and oil service group stocks have experienced substantial rallies and could be warning of an impending correction and/or trend reversal. BHI triggers a short on a decline beneath 46.97 and OXY goes short if it drops below 89.26. As far as buy setups go, Anadarko Petroleum (APC) looks interesting; if it fails to rise above 71.07, then that could also be another confirmation that the oil exploration/production stocks are going to pull back a bit. Wells Fargo (WFC) triggers a long entry on a rise above 34.20; the stock is manifesting a bearish price/money flow divergence and needs to be looked at as a short-term swing trade rather than a covered call or trend-following play, in Pendy's Picks' opinion. |
|
| FIGURE 3: SWING BUY SIGNALS. The S&P 100 (.OEX) components issuing RMO swing buy signals at the close of trading on Thursday, August 16, 2012; 5% of all .OEX components fired swing buy setup signals during this session, with two new swing sell setup signals also being issued. |
| Graphic provided by: MetaStock. |
| Graphic provided by: MetaStock Explorer. |
| |
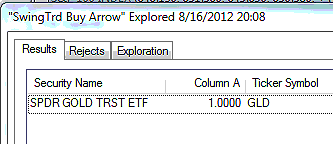
| In the exchange traded fund (ETF) corner of the US stock market, we find that the same ETF -- the SPDRs Gold ETF (GLD) (Figure 4) -- is firing a signal, but this time it's a buy signal. Wednesday's sell setup wasn't triggered and Thursday's bullish reversal in the metal certainly looks convincing enough for swing traders and daytraders to capitalize on. Gold's long-term outlook remains cloudy and is probably best used as a short-term trading vehicle rather than as an investment play, at least until its cyclical picture becomes more focused. A rise above Thursday's high of 157.09 triggers a long entry into this highly liquid ETF. |
|
| FIGURE 4: SWING BUY SETUP SIGNAL. The one ETF that fired a new RMO swing buy setup signal as of the close of trading on Thursday, August 16, 2012; there were no new RMO swing sell setup signals on Thursday. |
| Graphic provided by: MetaStock. |
| Graphic provided by: MetaStock Explorer. |
| |
| The .OEX surprised traders and investors once again on Thursday, deciding to head north in the wake of its most recent breakout. Although the maximum price target for the June to August 2012 rally has now been raised to 731.74, be aware that the minimum price target of 640.87 has already been exceeded and that the entire rally is expected to terminate no later than September 4, 2012. As always, trade wisely until we meet here again. |
Donald W. Pendergast is a financial markets consultant who offers specialized services to stock brokers and high net worth individuals who seek a better bottom line for their portfolios.
| Title: | Writer, market consultant |
| Company: | Linear Trading Systems LLC |
| Jacksonville, FL 32217 | |
| Phone # for sales: | 904-239-9564 |
| E-mail address: | lineartradingsys@gmail.com |
Traders' Resource Links | |
| Linear Trading Systems LLC has not added any product or service information to TRADERS' RESOURCE. | |
Click here for more information about our publications!
PRINT THIS ARTICLE

Request Information From Our Sponsors
- StockCharts.com, Inc.
- Candle Patterns
- Candlestick Charting Explained
- Intermarket Technical Analysis
- John Murphy on Chart Analysis
- John Murphy's Chart Pattern Recognition
- John Murphy's Market Message
- MurphyExplainsMarketAnalysis-Intermarket Analysis
- MurphyExplainsMarketAnalysis-Visual Analysis
- StockCharts.com
- Technical Analysis of the Financial Markets
- The Visual Investor
- VectorVest, Inc.
- Executive Premier Workshop
- One-Day Options Course
- OptionsPro
- Retirement Income Workshop
- Sure-Fire Trading Systems (VectorVest, Inc.)
- Trading as a Business Workshop
- VectorVest 7 EOD
- VectorVest 7 RealTime/IntraDay
- VectorVest AutoTester
- VectorVest Educational Services
- VectorVest OnLine
- VectorVest Options Analyzer
- VectorVest ProGraphics v6.0
- VectorVest ProTrader 7
- VectorVest RealTime Derby Tool
- VectorVest Simulator
- VectorVest Variator
- VectorVest Watchdog