HOT TOPICS LIST
- MACD
- Fibonacci
- RSI
- Gann
- ADXR
- Stochastics
- Volume
- Triangles
- Futures
- Cycles
- Volatility
- ZIGZAG
- MESA
- Retracement
- Aroon
INDICATORS LIST
LIST OF TOPICS
PRINT THIS ARTICLE
by Donald W. Pendergast, Jr.
Now that shares of ExxonMobil have moved above recent highs, what's next for the stock price of this global energy giant?
Position: N/A
Donald W. Pendergast, Jr.
Donald W. Pendergast is a financial markets consultant who offers specialized services to stock brokers and high net worth individuals who seek a better bottom line for their portfolios.
PRINT THIS ARTICLE
CYCLES
Positive Long-Term Cycles For ExxonMobil
08/23/12 09:04:44 AMby Donald W. Pendergast, Jr.
Now that shares of ExxonMobil have moved above recent highs, what's next for the stock price of this global energy giant?
Position: N/A
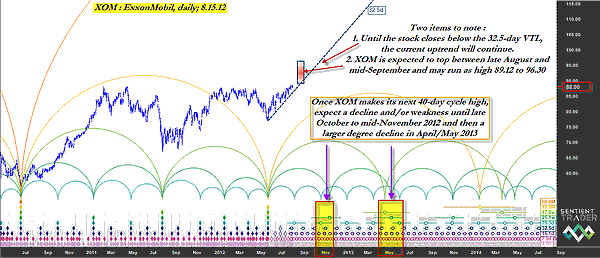
| Although it's not usually as trendworthy as some of the oil services industry stocks, ExxonMobil (XOM) can still make some impressive, sustained swing moves from time to time, especially after the bottoms and tops of many key price cycles at the same general time. Here's a look at XOM's daily cycle chart now (Figure 1), where we can get an idea about the direction its key cycles may direct the stock in over the next few months. |

|
| FIGURE 1: XOM, DAILY. Cycles analysis for XOM suggests a major multicycle low in the spring of 2013 and a smaller-degree cycle low in October 2012. |
| Graphic provided by: Sentient Trader. |
| |
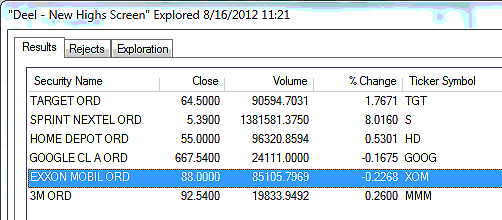
| XOM's main cyclical driver for each of its major rallies (for the first month or two in each case, anyway) since 2005 has been its 19.9-month cycle. Even after enduring a terrible selloff into the autumn of 2008, once this key cycle bottomed and reversed higher, XOM always made a healthy gain coming out of such bear troughs. This key cycle most recently bottomed on June 4, 2012, and, not surprisingly, XOM has again experienced a solid rally, gaining nearly 15% since then. As we glance at XOM's daily cycles chart, we see that the stock is trending steadily higher and has as yet to make a daily close below its 32.5-day valid trendline (VTL) (a key technical tool used to help confirm cycle highs and lows). Until that VTL is breached with a daily close below it, this uptrend in XOM needs to be given every benefit of the doubt, especially since the stock is now trading at a 49-month high -- and finally free of the resistance barriers put in place by previous highs set in 2011 and 2012. Time/price (TP) projection analysis is now suggesting that XOM should rise to a minimum price target of 89.12 and may actually reach a maximum price target of 96.30; the time window to expect the stock to make its next nominal 40-day cycle high is between August 28 and September 16, 2012. The red box on the chart highlights this critical TP zone. Once this anticipated cycle high is complete, cycles analysis also suggests that the next cluster of upcoming cycle lows may occur sometime between late October and mid-November 2012 (leftmost yellow box); it further suggests that April/May 2013 (right-side yellow box) could be an even larger-degree multicycle low, with as many as seven cycles anticipated to bottom at the same general time. See Figure 2. |

|
| FIGURE 2: XOM. XOM is now at a 49-month high, having finally broken above its major highs set during 2011 and 2012. |
| Graphic provided by: MetaStock. |
| Graphic provided by: MetaStock Explorer. |
| |
| While it's tempting to put on a covered call in such a strongly trending stock, the fact that cycle projections suggest that a reversal could occur within 12 calendar days make this a relatively risky trading proposition. Intraday traders might still find plenty of "buy on pullbacks" long setups, and if they exit all trades at the end of each trading session, the risk of a sharp overnight reversal will be negated. Existing longs should use the same trendline depicted on Figure 1 to guide them as to when to exit long positions with a profit; be aware that XOM could have a sharp selloff, falling along with the .OEX, which is also expected to correct sometime between now and the first week of September 2012. Option traders might consider long put purchases once the VTL is broken on a daily close, using at-the-money puts with at least two to three months of time value; 85.50 and then 83.50 are the nearest significant support levels in XOM and you may wish to choose one of them at your profit target for such put plays. Always limit your risk, plan your trades, never let a nice winning trade turn into an unfortunate loser and your trading/investing career should prove to be a fun and profitable pastime. |
Donald W. Pendergast is a financial markets consultant who offers specialized services to stock brokers and high net worth individuals who seek a better bottom line for their portfolios.
| Title: | Writer, market consultant |
| Company: | Linear Trading Systems LLC |
| Jacksonville, FL 32217 | |
| Phone # for sales: | 904-239-9564 |
| E-mail address: | lineartradingsys@gmail.com |
Traders' Resource Links | |
| Linear Trading Systems LLC has not added any product or service information to TRADERS' RESOURCE. | |
Click here for more information about our publications!
PRINT THIS ARTICLE

Request Information From Our Sponsors
- StockCharts.com, Inc.
- Candle Patterns
- Candlestick Charting Explained
- Intermarket Technical Analysis
- John Murphy on Chart Analysis
- John Murphy's Chart Pattern Recognition
- John Murphy's Market Message
- MurphyExplainsMarketAnalysis-Intermarket Analysis
- MurphyExplainsMarketAnalysis-Visual Analysis
- StockCharts.com
- Technical Analysis of the Financial Markets
- The Visual Investor
- VectorVest, Inc.
- Executive Premier Workshop
- One-Day Options Course
- OptionsPro
- Retirement Income Workshop
- Sure-Fire Trading Systems (VectorVest, Inc.)
- Trading as a Business Workshop
- VectorVest 7 EOD
- VectorVest 7 RealTime/IntraDay
- VectorVest AutoTester
- VectorVest Educational Services
- VectorVest OnLine
- VectorVest Options Analyzer
- VectorVest ProGraphics v6.0
- VectorVest ProTrader 7
- VectorVest RealTime Derby Tool
- VectorVest Simulator
- VectorVest Variator
- VectorVest Watchdog
