HOT TOPICS LIST
- MACD
- Fibonacci
- RSI
- Gann
- ADXR
- Stochastics
- Volume
- Triangles
- Futures
- Cycles
- Volatility
- ZIGZAG
- MESA
- Retracement
- Aroon
INDICATORS LIST
LIST OF TOPICS
PRINT THIS ARTICLE
by Donald W. Pendergast, Jr.
Google shares have experienced a substantial gain since putting in a minor double bottom pattern in mid- to late June 2012. Can the stock continue to rise near term?
Position: N/A
Donald W. Pendergast, Jr.
Donald W. Pendergast is a financial markets consultant who offers specialized services to stock brokers and high net worth individuals who seek a better bottom line for their portfolios.
PRINT THIS ARTICLE
CYCLES
Google To Pull Back?
08/22/12 08:23:44 AMby Donald W. Pendergast, Jr.
Google shares have experienced a substantial gain since putting in a minor double bottom pattern in mid- to late June 2012. Can the stock continue to rise near term?
Position: N/A
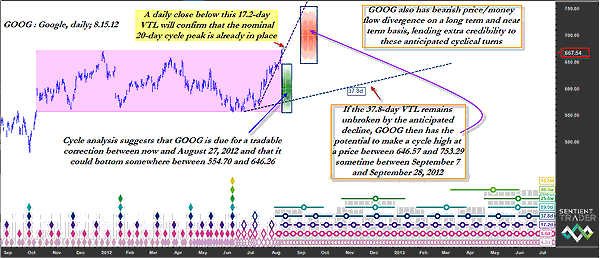
| Anytime a large-cap stock can tack on $102 in gains (per share, that is) in the space of two months, the investing public will start to pile into it -- and that's what appears to be happening now in Google (GOOG) shares. Unfortunately, price cycle analysis suggests that this recent rally in the stock is about to reverse and that the smart-money folks are unloading at least a portion of their holdings into the hands of starry-eyed, profit-hungry latecomers to this impressive rally. Here's a closer look at GOOG now (Figures 1 and 2). |

|
| FIGURE 1: GOOG, DAILY. With GOOG now right near the top of a well-defined range and bearish money flow divergences already in place after such a powerful two-month rally, the odds for this anticipated multicycle correction (into the green time/price projection zone) to occur are very high. |
| Graphic provided by: Sentient Trader. |
| |
| The stacked diamonds indicate the importance of any given multicycle low. In the case of the June 14, 2012, low, no less than eight cycles -- ranging from 4.2 days to 18.8 months in length measured from cycle low to cycle low -- all bottomed in the same time window, and the powerful rally over the past two months has been exceptionally powerful, with GOOG up by more than 18% in that time. In terms of price cycles, the long-term trend is still bullish, but the fact that four adjacent cycles -- the nine-day, 17-day, 37-day, and 89-day -- are all moving lower in unison paints a bearish near-term picture in the stock, even though it's currently at a fresh 52-week high. In the case of GOOG's rally, it's another example of the adage "Nothing exceeds like excess" all over again. Even though the stock is up 18% and four powerful short- to medium-term cycles are all warning of an imminent correction (see the chart for the projected time/price window for the anticipated correction and possible rebound to bottom/top within), investors still keep piling into this mega-cap issue. |

|
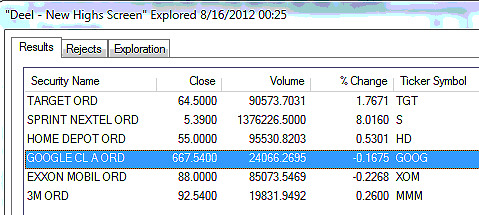
| FIGURE 2: OEX COMPONENTS. The six .OEX components identified by the Deel New Highs Screen as making fresh multimonth and/or multiyear highs as of August 15, 2012. |
| Graphic provided by: MetaStock. |
| Graphic provided by: Deel New Highs Screen from MetaStock v.11. |
| |
| One of the ways to determine if the smart money is distributing (that is, if they're unloading their long stock positions in GOOG onto less-savvy investors who are likely to take a near-term hit) is to check for confirmation of price/money flow divergences using the trusty Chaikin money flow histogram (not shown). The 34-day and 100-day variants of this powerful volume-derived indicator confirm that their histograms are making lower highs even as GOOG has gone on to make higher highs, a reliable sign that distribution is under way and a correction is likely soon to be seen. If you are not a long-term investor and have open long positions in this stock, you should be running very close stops. If GOOG makes a fresh daily close below the 17.2-day valid trendline (VTL) on the chart, you should seriously consider bailing out of the stock immediately, given the time/price projections for next anticipated cycle low (green box) on the chart. |
| Aggressive, highly capitalized traders might consider selling near-term out-of-the-money calls once the uppermost VTL is breached. Ordinary, garden-variety traders are probably better suited to a long put strategy, buying at-the-money puts with at least two to three months of time value remaining. Look to set a price target of about 636.00 (the August 10, 2012, swing low) to close out such long puts, as the risk of a profit-killing reversal grows dramatically by going for a larger target (say, 625.00 to 630.00). The cycle analysis here looks to be reliable and timely and should motivate existing longs to protect open gains even as it informs traders of some possible put option plays. If you choose to play the upcoming correction in GOOG with puts, make sure you have a well-thought-out strategy and you strictly limit your risk to no more than 1% or 2% of your account value. |
Donald W. Pendergast is a financial markets consultant who offers specialized services to stock brokers and high net worth individuals who seek a better bottom line for their portfolios.
| Title: | Writer, market consultant |
| Company: | Linear Trading Systems LLC |
| Jacksonville, FL 32217 | |
| Phone # for sales: | 904-239-9564 |
| E-mail address: | lineartradingsys@gmail.com |
Traders' Resource Links | |
| Linear Trading Systems LLC has not added any product or service information to TRADERS' RESOURCE. | |
Click here for more information about our publications!
Comments
Date: 08/22/12Rank: 4Comment:

Request Information From Our Sponsors
- StockCharts.com, Inc.
- Candle Patterns
- Candlestick Charting Explained
- Intermarket Technical Analysis
- John Murphy on Chart Analysis
- John Murphy's Chart Pattern Recognition
- John Murphy's Market Message
- MurphyExplainsMarketAnalysis-Intermarket Analysis
- MurphyExplainsMarketAnalysis-Visual Analysis
- StockCharts.com
- Technical Analysis of the Financial Markets
- The Visual Investor
- VectorVest, Inc.
- Executive Premier Workshop
- One-Day Options Course
- OptionsPro
- Retirement Income Workshop
- Sure-Fire Trading Systems (VectorVest, Inc.)
- Trading as a Business Workshop
- VectorVest 7 EOD
- VectorVest 7 RealTime/IntraDay
- VectorVest AutoTester
- VectorVest Educational Services
- VectorVest OnLine
- VectorVest Options Analyzer
- VectorVest ProGraphics v6.0
- VectorVest ProTrader 7
- VectorVest RealTime Derby Tool
- VectorVest Simulator
- VectorVest Variator
- VectorVest Watchdog
