

HOT TOPICS LIST
- MACD
- Fibonacci
- RSI
- Gann
- ADXR
- Stochastics
- Volume
- Triangles
- Futures
- Cycles
- Volatility
- ZIGZAG
- MESA
- Retracement
- Aroon
INDICATORS LIST
LIST OF TOPICS
PRINT THIS ARTICLE
by Donald W. Pendergast, Jr.
The .OEX tacked on a tiny gain Tuesday, but the intraday price action suggests that the index has hit an important resistance level.
Position: N/A
Donald W. Pendergast, Jr.
Donald W. Pendergast is a financial markets consultant who offers specialized services to stock brokers and high net worth individuals who seek a better bottom line for their portfolios.
PRINT THIS ARTICLE
TECHNICAL ANALYSIS
Pendy's Picks : August 15, 2012
08/15/12 02:12:50 PMby Donald W. Pendergast, Jr.
The .OEX tacked on a tiny gain Tuesday, but the intraday price action suggests that the index has hit an important resistance level.
Position: N/A
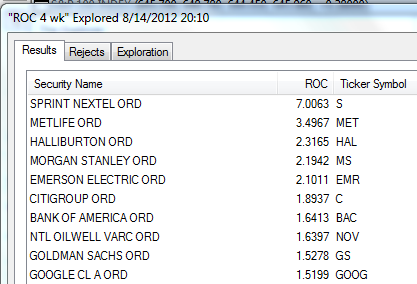
| The .OEX (Standard and Poor's 100) finished Tuesday's trading session at 645.96, closing up by .05%; the index ran higher during the session but hit strong resistance near 648.78, pulling back from the new multimonth high and closing very close to where it opened the session. This defacto repudiation of a new breakout attempt is a very important development, given that it comes at a time when the .OEX has already satisfied its minimum time/price target for a multicycle high to be made. Schlumberger (SLB) and Accenture (ACN) have just issued new sell signals, as have several other large cap stocks, so traders need to be prepared to face the fact that the .OEX may have actually peaked during Tuesday's session and is now ready to roll over - perhaps in the first stage of a bearish trend reversal, or even a simple pullback prior to another attempt at a new high. Figure 1 show us the strongest 4-week relative strength (RS) performers in the .OEX; only two energy sector stocks remain on this list, with Halliburton (HAL) and National Oilwell Varco (NOV) still outperforming the .OEX and .SPX. Sprint Nextel (S) made a new intraday high and then closed lower on the session; this one may also issue a new sell signal this week. Walgreen's (WAG) has finally dropped off of the top ten RS list and has actually fired a new swing sell setup signal. MetLife (MET), Citigroup (C), Morgan Stanley (MS) and Goldman Sachs (GS) are the four formidable financials that were helping push the .OEX higher - at least until Tuesday that is. |
|
| Figure 1: The 10 strongest S&P 100 (.OEX) components over the past month, as of Tuesday, August 14, 2012. |
| Graphic provided by: MetaStock. |
| Graphic provided by: Metastock's Explorer. |
| |
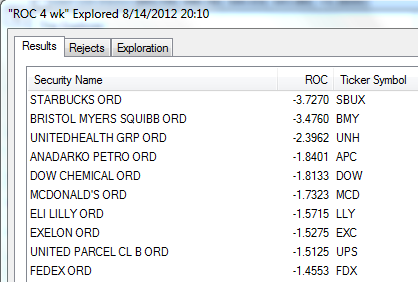
| Figure 2 is a look at the weakest 4-week relative strength performers in the .OEX; there is virtually no change from Monday - once again, Starbucks (SBUX) and Bristol Myers Squibb (BMY) are battling it out for the title of 'the worst of the worst performing stocks' title, and Eli Lilly (LLY) , United Health Group (UNH) and Anadarko Petroleum (APC) are still the stocks that bulls love to hate. If the .OEX truly is on the verge of a correction/and/or trend reversal, it will be interesting to see how this weak RS list begins to change; for all we know, more energy stocks may actually start appearing here, particularly if crude oil corrects over the next 4 to 6 weeks, as anticipated. |
|
| Figure 2: The 10 weakest S&P 100 (.OEX) components over the past month, as of Tuesday, August 14, 2012. |
| Graphic provided by: MetaStock. |
| Graphic provided by: Metastock's Explorer. |
| |
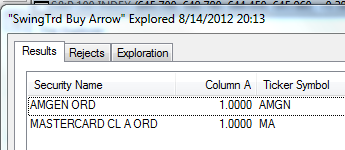
| Figure 3 are the S&P 100 components giving RMO swing buy setup signals; 2% of the .OEX components issued new RMO swing buy signals on Tuesday; there was also one new swing sell setup in Walgreen's (WAG). If WAG declines below 35.62 it will trigger a new short entry, voiding out the possibility of a near term bullish confirmation move. Of the two buy signals, Mastercard (MA), a financial issue, is likely a bit too late to milk further gains from the ten-week old bullish run in the .OEX. Amgen (AMGN) is also looking a bit parabolic here, yet if it can rise above 83.62, the odds would still seem to favor some more upside. Look out below, however, when this hi-flier finally decides to stage a correction. |
|
| Figure 3: The S&P 100 (.OEX) components issuing RMO swing buy signals at the close of trading on Tuesday, August 14, 2012; 2% of all .OEX components fired swing buy setup signals during this session, with one new swing sell setup signal also being issued. |
| Graphic provided by: MetaStock. |
| Graphic provided by: Metastock's Explorer. |
| |
| Once again, there were no buy or sell setup signals in any of the ETFs that Pendy's Picks regularly tracks; such a sign of continued equilibrium and/or neutrality may be a warning that the market is ready to make a sudden move in either direction. The .OEX rose a tiny fraction on Tuesday, but with its intraday price action staging a sharp reversal after rising to a new multimonth high of 648.78, it is very possible that several key price cycles are at or very near to their respective highs. While further upside is entirely possible, the chances for another sizable, bullish swing to commence between now and early September diminish a little more every day. To repeat the advice from Monday's edition of Pendy's Picks: "all of the technicals and cycles confirm that a significant reversal and/or corrective move of the June thru August 2012 rally is imminent." As always, trade wisely until we meet here again. |
Donald W. Pendergast is a financial markets consultant who offers specialized services to stock brokers and high net worth individuals who seek a better bottom line for their portfolios.
| Title: | Writer, market consultant |
| Company: | Linear Trading Systems LLC |
| Jacksonville, FL 32217 | |
| Phone # for sales: | 904-239-9564 |
| E-mail address: | lineartradingsys@gmail.com |
Traders' Resource Links | |
| Linear Trading Systems LLC has not added any product or service information to TRADERS' RESOURCE. | |
Click here for more information about our publications!
PRINT THIS ARTICLE

Request Information From Our Sponsors
- StockCharts.com, Inc.
- Candle Patterns
- Candlestick Charting Explained
- Intermarket Technical Analysis
- John Murphy on Chart Analysis
- John Murphy's Chart Pattern Recognition
- John Murphy's Market Message
- MurphyExplainsMarketAnalysis-Intermarket Analysis
- MurphyExplainsMarketAnalysis-Visual Analysis
- StockCharts.com
- Technical Analysis of the Financial Markets
- The Visual Investor
- VectorVest, Inc.
- Executive Premier Workshop
- One-Day Options Course
- OptionsPro
- Retirement Income Workshop
- Sure-Fire Trading Systems (VectorVest, Inc.)
- Trading as a Business Workshop
- VectorVest 7 EOD
- VectorVest 7 RealTime/IntraDay
- VectorVest AutoTester
- VectorVest Educational Services
- VectorVest OnLine
- VectorVest Options Analyzer
- VectorVest ProGraphics v6.0
- VectorVest ProTrader 7
- VectorVest RealTime Derby Tool
- VectorVest Simulator
- VectorVest Variator
- VectorVest Watchdog